Low Carbon Transition Rating
ESG Risk Ratings
Methodology Abstract
Introduction
What the ESG Risk Ratings Measure
A company’s economic value is at risk driven by ESG factors
The ESG Risk Ratings measure the degree to which a company’s economic value is at risk driven by ESG factors or, more technically speaking, the magnitude of a company’s unmanaged ESG risks. A company’s ESG Risk Rating is comprised of a quantitative score and a risk category. The quantitative score represents units of unmanaged ESG risk with lower scores representing less unmanaged risk. Unmanaged Risk is measured on an open-ended scale starting at zero (no risk) and, for 95% of cases, a maximum score below 50. Based on their quantitative scores, companies are grouped into one of five risk categories (negligible, low, medium, high, severe). These risk categories are absolute, meaning that a ‘high risk’ assessment reflects a comparable degree of unmanaged ESG risk across all subindustries covered. This means that a bank, for example, can be directly compared with an oil company or any other type of company. With the ESG Risk Ratings’ scores, we have introduced a single currency for ESG risk.
Defining Materiality and Risk
Influence on the decisions made by a reasonable investor
An issue is considered to be material within the ESG Risk Ratings if its presence or absence in financial reporting is likely to influence the decisions made by a reasonable investor. To be considered relevant in the ESG Risk Ratings, an issue must have a potentially substantial impact on the economic value of a company and, hence, its financial risk- and return profile from an investment perspective.
Underlying premise is the transitioning to a more sustainable economy
Note that an underlying premise of the ESG Risk Ratings is that the world is transitioning to a more sustainable economy and that the effective management of ESG risks should, therefore, be associated with superior long-term enterprise value, ceteris paribus. Some issues are considered material from an ESG perspective even if the financial consequences are not fully measurable today.
The Three Building Blocks
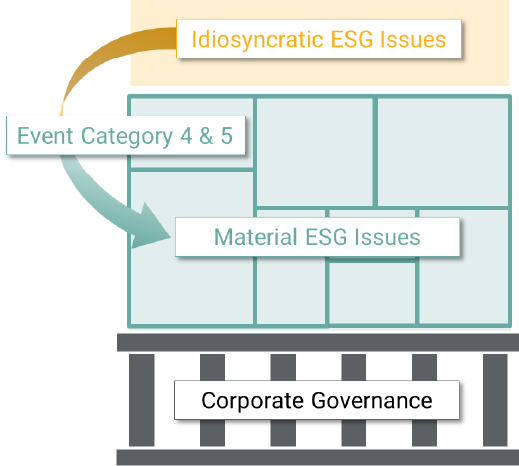
The ESG Risk Ratings are composed of three building blocks that contribute to a company’s overall rating. These building blocks include Corporate Governance, material ESG issues (MEIs), and idiosyncratic ESG issues.
Exhibit 1: The three building blocks of the ESG Risk Ratings
Source: Sustainalytics
Building Block #1: Corporate Governance
A foundational element in the ESG Risk Ratings
Corporate Governance is a foundational element in the ESG Risk Ratings and reflects our conviction that poor Corporate Governance poses material risks for companies. It applies to all companies in our rating universe, irrespective of the subindustry they are in. The exposure to Corporate Governance is similar across the board. Only Category 4 or 5 events result in an adjustment of a company’s exposure score. On average, unmanaged Corporate Governance risk contributes round about 20% to the overall unmanaged risk score of a company. The final weight varies depending on the individual selection of material ESG issues for that specific company.
Building Block #2: Material ESG Issues
Material ESG issues form the core and centre of our rating
Material ESG issues are focused on a topic, or set of related topics, that require a common set of management initiatives or a similar type of oversight. For example, the topics of employee recruitment, development, diversity, engagement and labour relations are all encompassed by the material ESG issue of Human Capital because they are all employee-related and require Human Resources initiatives and oversight. The common thread behind all Human Capital topics is attracting and retaining qualified employees.
Occupational Health and Safety also concerns employees, but the common thread here is to ensure the health and safety of employees at their workplace. The business risks associated with this are different from general Human Capital risks, and it is managed through a different set of activities.
The assessment of material ESG issues occurs at the subindustry level and is reviewed annually through a comprehensive and structured process (see page 13). At a company level, material ESG issues can be removed from the rating if they are not relevant to the company’s business model.
Distinguishing between systematic and unpredictable ESG issues
The Material ESG Issues building block of the ESG Risk Ratings forms the core and center of our methodology. It rests on the assumption that ESG issues can influence the economic value of a company in a given subindustry in a fairly predictable manner. Our rating is forward looking in the sense that it identifies these issues based on the typical business model and business environment a company is operating in. However, there are issues that may become significant or material in an unpredictable manner. We take these kinds of issues into account as ‘Idiosyncratic Issues’. They form the third building block of the ESG Risk Ratings.
Building Block #3: Idiosyncratic Issues
Driven by Category 4 or 5 events
Idiosyncratic Issues are ‘unpredictable’ or unexpected in the sense that they are unrelated to the specific subindustry and the business model(s) that can be found in that subindustry. For example, an accounting scandal is certainly nothing that is more predictable in some industries than in others. It could happen at any company across all sectors and, hence, falls outside of the logic with which we capture subindustry-specific material ESG issues. Typically, issues like this are event-driven; some might call them ‘black swans’. Idiosyncratic Issues, therefore, become material ESG issues if the associated event assessment passes a significance threshold. This threshold has been set at a Category 4 or 5 level. Note that idiosyncratic issues become material issues only for the specific company in question, not for the entire subindustry that company is part of. This is another differentiator to the second building block of the risk ratings, the Material ESG Issues.
Two Rating Dimensions
Exposure and Management – the two dimensions of the risk ratings
The ESG Risk Ratings’ approach to materiality required a departure from the traditional, one-dimensional rating concepts. We introduced a two-dimensional architecture with the first dimension, exposure, reflecting the extent to which a company is exposed to material ESG risks at the overall and the individual MEI level, and the second one, Management, reflecting how well a company is managing its exposure.
Exposure
Determined by a set of ESG-related factors that pose potential economic risks for companies
Exposure can be considered as a set of ESG-related factors that pose potential economic risks for companies. Another way to think of exposure is as a company’s sensitivity or vulnerability to ESG risks. Material ESG issues and their exposure scores are assessed at the subindustry level and then refined at the company level.
Subindustry Exposure Assessment
Top-down assessment of subindustry exposure
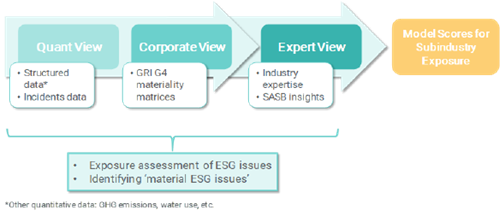
As a starting point, the exposure of companies that operate in the same subindustry (as characterized by roughly similar products and business models) vis-à-vis a set of potentially relevant ESG issues is determined. The assessment is done in a centralized and guided manner leveraging the expertise of our sector research teams (see Exhibit 2 and page 14). Factors that are used to inform the assessment include the companies’ events track record, structured external data (e.g. CO2 emissions), company reporting, and third-party research. Scores are updated on an annual basis. Driven by the outcome of the assessment, the set of material ESG issues as well as the set of indicators that are used to evaluate how well a company is managing its material ESG issues may change over time.
Exhibit 2: Subindustry Exposure Assessment Process
Source: Sustainalytics
Beta Assessment
Making the ESG Risk Ratings company specific
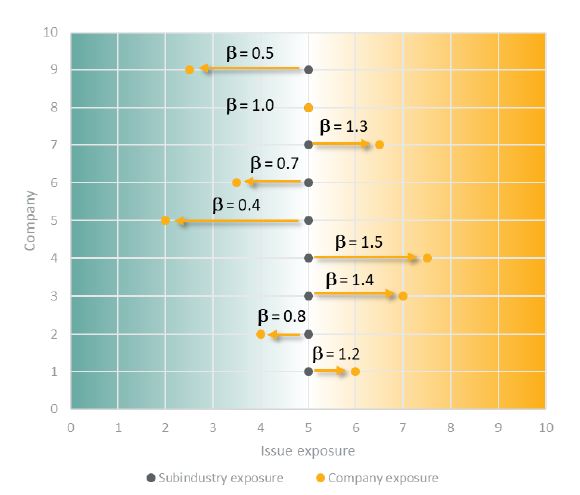
Betas are a key part of what makes the ESG Risk Ratings company specific. They reflect the degree to which a company’s exposure to a material ESG issues deviates from the average exposure to that issue within its subindustry (see Exhibit 3). To arrive at a company’s exposure score for a particular ESG issue, the subindustry exposure score is multiplied by the company’s issue beta.
Exhibit 3: Using the beta concept to arrive at company-specific exposure assessments
Source: Sustanalytics
Beta Indicators & Beta Signals
Four distinct thematic areas: Product & Production, Financials, Events, and Geographic
The beta for a company vis-à-vis an ESG issue is calculated in a three-stage process (as shown in Exhibit 4). The core of our model is a list of subindustry and MEI specific so-called ‘Beta Indicators’. Their assessment constitutes the first step in the process. The outcomes of this assessment generate so-called ‘Beta Signals’ that finally get added to the subindustry default beta value of 1 together with the Qualitative Overlay and the Correction Factor.
Beta indicators have been created for four distinct thematic areas: Product & Production, Financials, Events, and Geographic. In a second step, a qualitative overlay may be applied by our analysts when updating a company profile to reflect company specific factors that are not reflected in the standard model. Finally, a technical correction factor is applied to assure that the average beta within a subindustry is one.
Exhibit 4: Model for calculating issue betas
Beta Signals
Product & Production
- Derived Beta Indicators
- Build-for-purpose Beta Indicators
Financials
- Assessment of relative financial strength
- Based on third-party provided metrics
Events
- Events (relative frequency & severity)
- Significant events adjustments (cat4 & 5)
Geographic
- Country Risk
- Headquarter, Revenues and Assets
+
Qualitative Overlay
- Capture additional factors
- Adjust for factor biases
Correction Factor
- Assure average beta of 1 at subindustry level Beta
Manageable Risk Factors
The share of risk that is manageable is predefined at a subindustry level
For some material ESG issues, the risk cannot be fully managed. The share of risk that is manageable vs. the share of risk that is unmanageable is predefined at a subindustry level by a manageable risk factor (MRF). MRFs range from 30% to 100% and represent the share of exposure to a material ESG issue that that is deemed to be (at least theoretically) manageable by the company.
Achieving more realistic and comparable rating outcomes
We considered four primary factors when setting MRFs: the ability of a company to ensure compliance by its employees (e.g. occupational health and safety), the effect of outside actors on the ability of a company to manage an issue (e.g. cybersecurity), the complexity of an issue (e.g. global supply chains), and the physical limitations on innovation or technology (e.g. airplanes and carbon emissions). MRFs are intended to achieve more realistic rating outcomes and to ensure the comparability of ratings across companies and subindustries.
Management
Distinguishing between Management-, Quantitative Performance, and Event Indicators
The ESG Risk Ratings’ second dimension is Management. It can be considered as a set of company commitments, actions and outcomes that demonstrate how well a company is managing the ESG risks it is exposed to.
The overall management score for a company is derived from a set of management indicators (policies, management systems, certifications, etc.) and outcome-focused indicators. Outcome-focused indicators measure management performance either directly in quantitative terms (e.g. CO2 emissions or CO2 intensity) or via a company’s involvement in controversies (represented by the company’s event indicators). For each material ESG issue/subindustry combination, management-, quantitative performance-, and event indicators have been selected and weighted so that they collectively provide the strongest signal to explain and measure how well a company manages an issue.
Management Indicators
ESG indicators are the smallest assessment unit used to measure a company’s management of ESG issues. They provide a systematic and consistent way of assessing clearly delineated and standardized criteria. These criteria are based on key areas of risk or best practices that help to distinguish between the performance of different companies. Indicators are scored on a scale of 1-100.
Event Indicators
Indication for ESG risks not properly being managed
Sustainalytics assesses companies’ level of involvement in controversial events that have an impact on the environment or society. Involvement in events may indicate that a company’s management systems are not adequate to manage relevant ESG risks. Each event is categorized from Category 1 (low impact on environment and society, posing negligible risks to the company) to Category 5 (severe impact on the environment and society, posing serious risks to the company). Every material ESG issue has one or more events linked to it.
Calculating the ESG Risk Ratings
Unmanaged Risk
Unmanaged Risks at the issue and the overall level
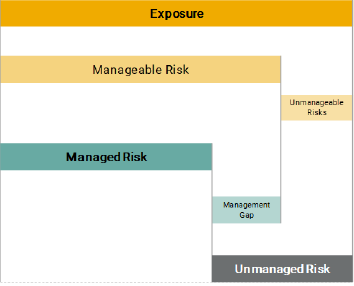
The final ESG Risk Ratings scores are a measure of unmanaged risk, which is defined as material ESG risk that has not been managed by a company. It includes two types of risk: unmanageable risk, which cannot be addressed by company initiatives, as well as the management gap. The management gap represents risks that could potentially be managed by a company but aren’t sufficiently managed according to our assessment.
Scoring occurs in three steps
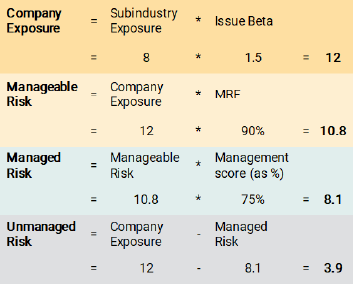
The ESG Risk Ratings scoring system for a company is best thought of as occurring in three stages (from top to bottom, see Exhibit 5). The starting point is determining exposure. The next stage is assessing management and the degree to which risk is managed, and the final stage is calculating unmanaged risk. This structure applies to individual material ESG issues as well as the company’s overall ESG Risk Ratings.
Exhibit 5: ESG Risk Ratings – the scoring structure
Source: Sustainalytics
Distinguishing between manageable and unmanageable risks
The top bar in the exhibit above represents a company’s ESG risk exposure at the issue level. At the level below, manageable risks are separated from unmanageable ones with the help of the Manageable Risk Factor (see page 9). Unmanageable risk is one of the two components of unmanaged risk as shown in the exhibit above. The second component is the management gap. It speaks to the manageable part of the material ESG risks a company is facing and reflects the failure of the company to manage these risks sufficiently, as reflected in the company’s management indicator scores.
Total unmanaged risk
The final ESG Risk Ratings score is calculated as the sum of the individual material ESG issues’ unmanaged risk scores. It is the overall unmanaged risk of a company. As it can also be seen in the exhibit, unmanaged risk is the combination of a company’s management gap and unmanageable risks. Alternatively, it is the difference between a company’s exposure and its managed risk.
E/S/G Cluster Scores
Providing additional information on the E, the S, and the G
The ESG Risk Ratings are based on an absolute notion of risk and are structured around material ESG issues to which companies are exposed to in varying degrees. These material ESG issues may have a pure environmental, social, or governance character. Typically, however, they are mixed bags or combinations of two or all three of these. Hence, the E/S/G cluster scores that we provide have been constructed as linear combinations of scores that we generate at the material ESG issue level, where the weights reflect the relative importance of management- and event indicators for the respective issues. Note that all management- and event indicators have a one-to-one mapping to the clusters (i.e. they are either an E-, S-, or G-classified). Please note as well that our E/S/G cluster scores are not part of the ESG Risk Ratings architecture. They are not used to calculate the rating but are provided as additional information and to serve specific use cases.
Exhibit 6: E/S/G cluster scores as linear combinations of MEI scores

Source: Sustainalytics
The Core Framework
Two frameworks, one rating
The Core Framework was created to extend the coverage universe of the ESG Risk Ratings. It is derived from the full ESG Risk Ratings model and uses a reduced indicator set and structure to approximate the so-called Comprehensive Framework’s outcomes. The high predictive power of the streamlined model (see below) assures the comparability of final rating outcomes independent of the framework used.
Core Framework does not breakdown risks to MEI level
The most important difference between the two frameworks is that the Core Framework does not break down risk by material ESG issues. As the Manageable Risk Factor, events logic and betas are all applied at the material ESG issue level in the Comprehensive Framework; these elements have been slightly modified so that they can be applied at the overall company level in the Core Framework.
How the Core Framework Model was Developed
Consistency with the Comprehensive Framework
Predicting the outcomes of the comprehensive model
Technically speaking, the Core Framework model is a predictive model. It uses a focused set of indicators to generate comparable scores to the Comprehensive Framework. Indicators were not selected for inclusion in the model individually but rather as a set that collectively achieves the strongest correlation between a company’s predicted score based on the core estimation model and the known score (using the full model from the Comprehensive Framework). This method was preferable to choosing individual indicators that have a strong correlation with the overall score, as it is often a combination of indicators that creates the strongest correlation.
Accuracy of the Predictive Model
92% accuracy on average
Technically, the predictive model (the Core Framework model) has an average R-squared value of 92%, with variation between 86% and 97% depending on the subindustry. On average, the predictive model achieved an ESG Risk Ratings category accuracy (low risk, medium risk, etc.) above 88% when compared to the known company category. No company using the predictive model was more than one ESG Risk Ratings category away from the known ESG Risk Ratings category. These results provide confidence in the robustness of the Core Framework and allows for reasonable comparability across the Core- and Comprehensive Frameworks.
Research Process
Annual review of subindustry exposure scores, indicator selection, and indicator weights
The underlying research that brings our ESG Risk Ratings to life is based on three processes and research cycles. From a top-down perspective, we review our subindustry-specific exposure assessments on an annual basis. The purpose of these assessments, which are independent of individual companies’ assessments, is to validate the selection of material ESG issues for each subindustry. During this review, the exposure scores for different material ESG issues may be adjusted for the subindustry, along with the selection of management indicators. In addition, new management indicators may be introduced to better capture a company’s overall management score. Such enhancements are extensively tested of their impact on scores and need to stay in certain, pre-defined boundaries.
Clients are given advance notice of upcoming structural changes, like the addition of new data points, that can be implemented once a year. The subindustry level assessment changes as well as research of new data points is rolled-out on a company-by-company basis in combination with the regular annual profile update.
Regular annual update of company profiles
At the company level, we also have an annual update cycle. For each company in our Ratings universe, we run through a comprehensive research process and complete a full update of the company’s ESG Risk Ratings report. The update comprises company-specific exposure and management assessments. The research process starts with the collection of company data via public disclosure, media, and NGO reports. The data is then analysed according to the indicator framework. For every management or beta indicator, our analysts evaluate the degree to which a company fulfils a set of detailed and well-documented criteria. As a part of the annual update of an issuer’s ESG Risk Ratings report, existing event assessment are either confirmed or adjusted. Each annual ESG Risk Ratings update is followed by a robust peer review and quality assurance process.
Robust quality control process
The third component of our research process is related to our event assessments. These are done continuously throughout the year, driven by the relevant daily news-flow. Any assessment related to Category 4 or 5 events goes through a robust quality control process with special safeguards.
Company feedback process
Finally, the draft report is sent to every company in the Ratings universe for feedback. Our goal is to gather feedback on the accuracy of the information captured in the draft report, as well as to collect additional and updated information from the company. After the feedback is implemented, the ESG Risk Ratings report is made available to clients.
References
Garz, H. and Volk, C. (2018), “The ESG Risk Ratings, Moving up the Innovation Curve, White Paper–Volume 1”, Sustainalytics
Morrow, D., Syed, M., and Burress, S. (2018), “The ESG Risk Ratings, Exploring the Internet Software and Services Subindustry, White Paper–Volume 2”, Sustainalytics
Morrow, D., and Burress, S. (2019), “The ESG Risk Ratings, Potential Applications for Investors, White Paper–Volume 3,” Sustainalytics
ESG Risk Ratings Methodology, Version 2.1 (December 2020), Sustainalytics
ESG Risk Ratings Glossary, Version 2.0 (November 2019), Sustainalytics

