

Key Insights:
|
|
|
|
Over the past decade, low-carbon transition has moved from technological possibility toward economic reality. What remains unresolved is whether investment will shift at a sufficient pace and scale to translate that progress into real-world decarbonization. At the 2026 UN Climate Change Conference (COP31) in Antalya, Türkiye, the overarching goal remains to shift global focus from climate pledges to implementation of the 2015 Paris Agreement.
Electrification is central to that shift because it links clean power to end use. It is also a key theme at COP31. The COP31 Presidency has proposed a collective goal to raise electricity's share of final energy consumption to 35% by 2035, up from about 20%.1 To reach that goal, companies will need to translate it into their own decarbonization targets. As we highlight in our report, Transition or Illusion?, setting such targets is necessary, but it is not enough. We therefore view capital expenditure (capex) as an important signal of whether those targets are being funded, and electrification is where that test matters most.
Targets Show Ambition, but Capex Shows Action
Disclosure on decarbonization measures has matured through the introduction of various standards and frameworks, including the Task Force on Climate-Related Financial Disclosures (TCFD), International Sustainability Standards Board (ISSB), and IFRS S2 Sustainability Disclosures, and has significantly increased companies’ transparency on their climate transition commitments. Corporate climate targets, disclosures, and strategies have increased, but they remain poor differentiators of what companies are actually doing. If companies are not allocating capex to align with their strategies and meet goals, those strategies and goals remain aspirational, rather than actionable. The question for investors has shifted from, “Does the company have a target?” to “Is the company sufficiently funding the transition to achieve the target?”
Capex is a measure of real transition action. It provides insights into which assets are built and which technologies are deployed, and whether they line up with decarbonization targets. It shows true intent and, ultimately, the ability to execute those targets. Unlike traditional metrics (mainly emissions data), which tend to be backward-looking, capex shows what will be built next and is therefore more decision-useful for investors. And when we follow capex, it clearly points to electrification.
Low-Carbon Capex Is Concentrated in Electrification
Electrification is the bridge between building low-carbon capacity and decarbonizing the economy, and it is how COP31’s goal will be reached in which electricity accounts for 35% of final energy consumption by 2035. As transportation, buildings, and eventually industry become more reliant on electricity, investment must extend beyond renewable energy generation to grids and end-use technologies.
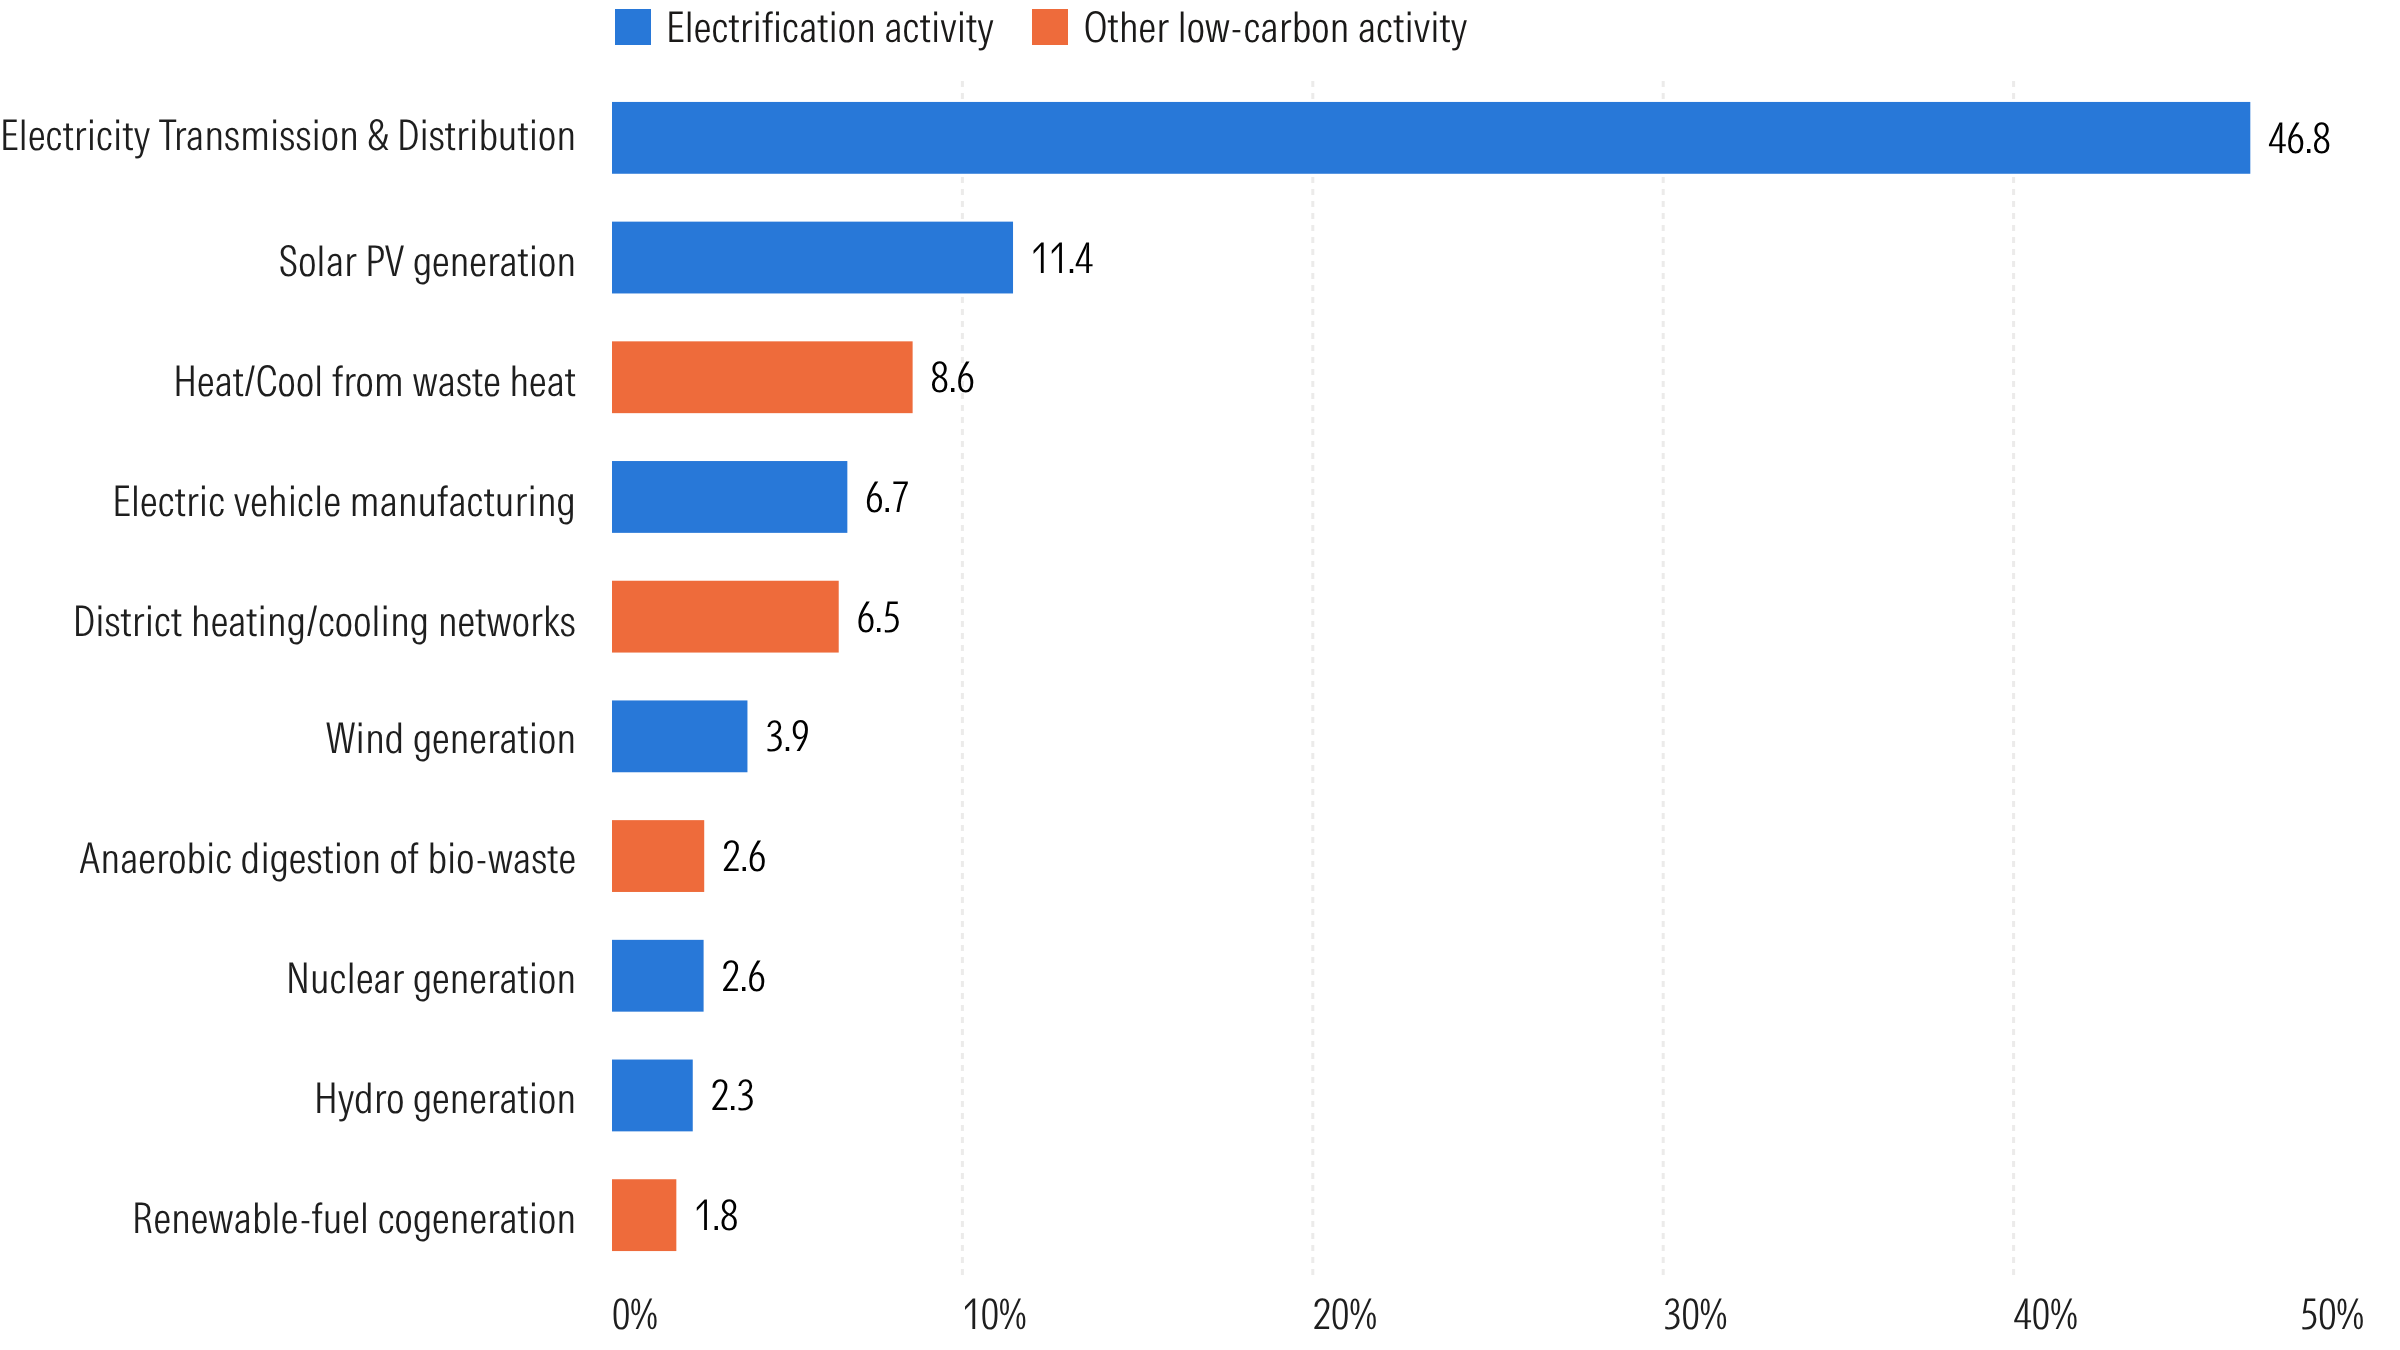
Our corporate capex data show that companies are already investing in this direction. Electrification-related activities account for about three-quarters of all low-carbon capex in our Low Carbon Transition Rating (LCTR) data coverage (see Figure 1), with investment flowing not only into low-carbon power generation but also into the network infrastructure and end-use technologies needed to support a more electrified economy.
Figure 1. Top 10 Low-Carbon Activities (% of Low-Carbon Capex), 2021–2028
Source: Morningstar Sustainalytics.
Note: Electrification activities are shown in dark blue. Based on activity-level capex for about 2,400 listed companies in Morningstar Sustainalytics’ capex dataset. 2025–2028 reflects capex plans disclosed by companies, which cover fewer companies than 2021–2024.
We view COP31’s electrification goal as a useful lens for assessing companies’ transition plans, and Figure 1 shows where the capex is going. Electricity transmission and distribution alone account for a large amount of low-carbon capex, well ahead of solar generation, electric vehicle (EV) manufacturing, and other generation capex. Where this money is spent, however, differs sharply by region.
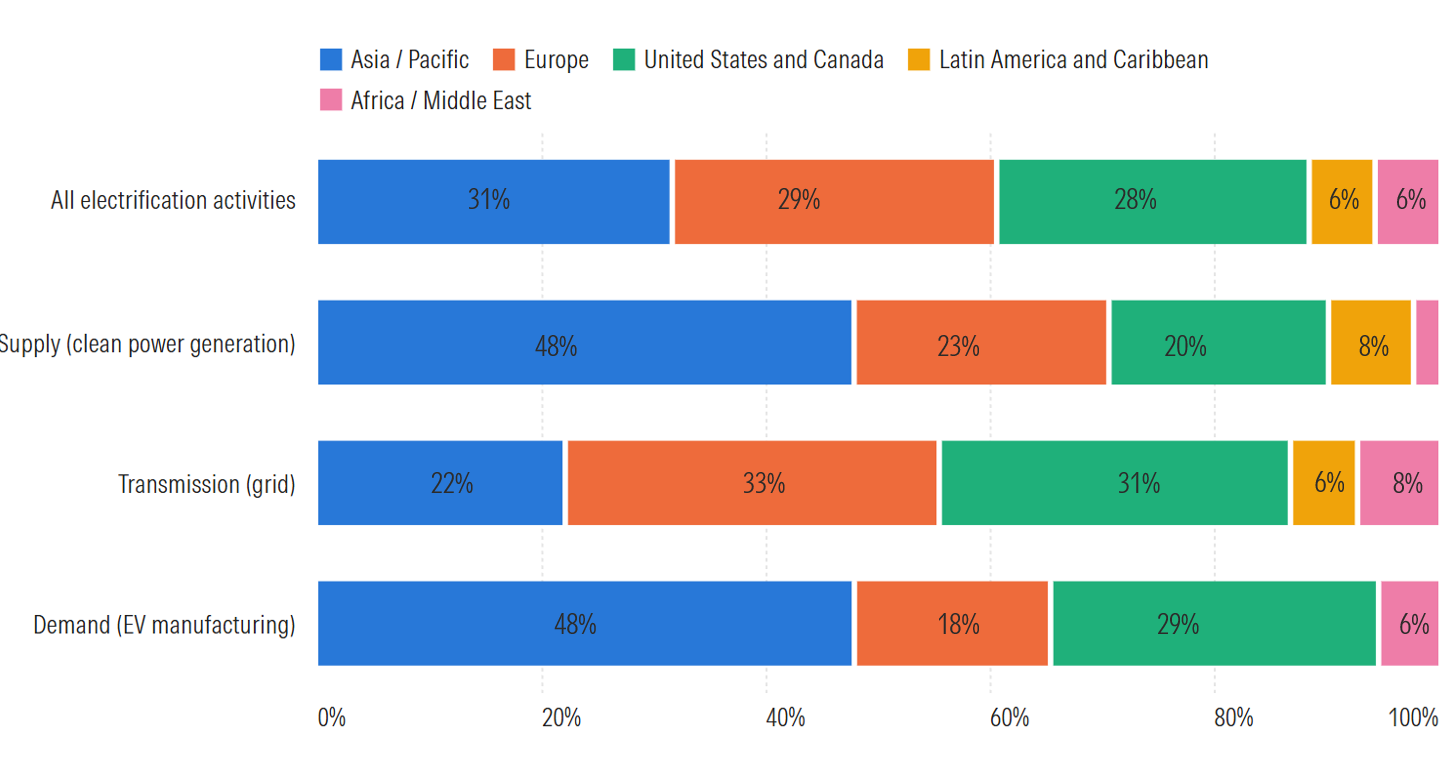
Figure 2. Regional Split of Electrification Capex, 2021–2028
Source: Morningstar Sustainalytics.
Note: Based on activity-level capex for about 2,400 listed companies in Morningstar Sustainalytics’ capex dataset. 2025–2028 reflects capex plans disclosed by companies, which cover fewer companies than 2021–2024.
Three Regions Dominate and Each Funds a Different Part of the System
Regionally, Asia-Pacific, Europe, and the US and Canada each account for about 30% of electrification capex, but they fund different parts of the system. For example, Asia-Pacific accounts for about half of global capex in power supply and EV manufacturing. This is driven largely by China, which met its 2030 wind and solar capacity target in 2024, six years early.2 Europe and North America, meanwhile, lead in electricity transmission, supported in both regions by increasing regulation for utilities. At the lagging end, Latin America and Africa/Middle East together receive only about one-tenth of electrification capex globally. This is a gap that matters for an electrification target set at the global level, as emerging and developing economies are expected to drive nearly 80% of electricity demand growth through to 2030.3
Electrification Needs Supply, Grids and Demand to Grow Together
Electrification is a system: generation, distribution, and demand. Clean generation produces power, the grid carries it, and end users (such as EVs) consume it. Each depends on the others. New solar farms, for example, have limited value without transmission lines to connect them, and EVs cut emissions only if the electricity they use comes from clean energy sources. To reach COP31’s 35% by 2035 target, all three parts of the system must grow together, and the fossil fuel capacity they replace must shrink. The balance between them — more than the absolute amounts — tells us whether electrification is on track.
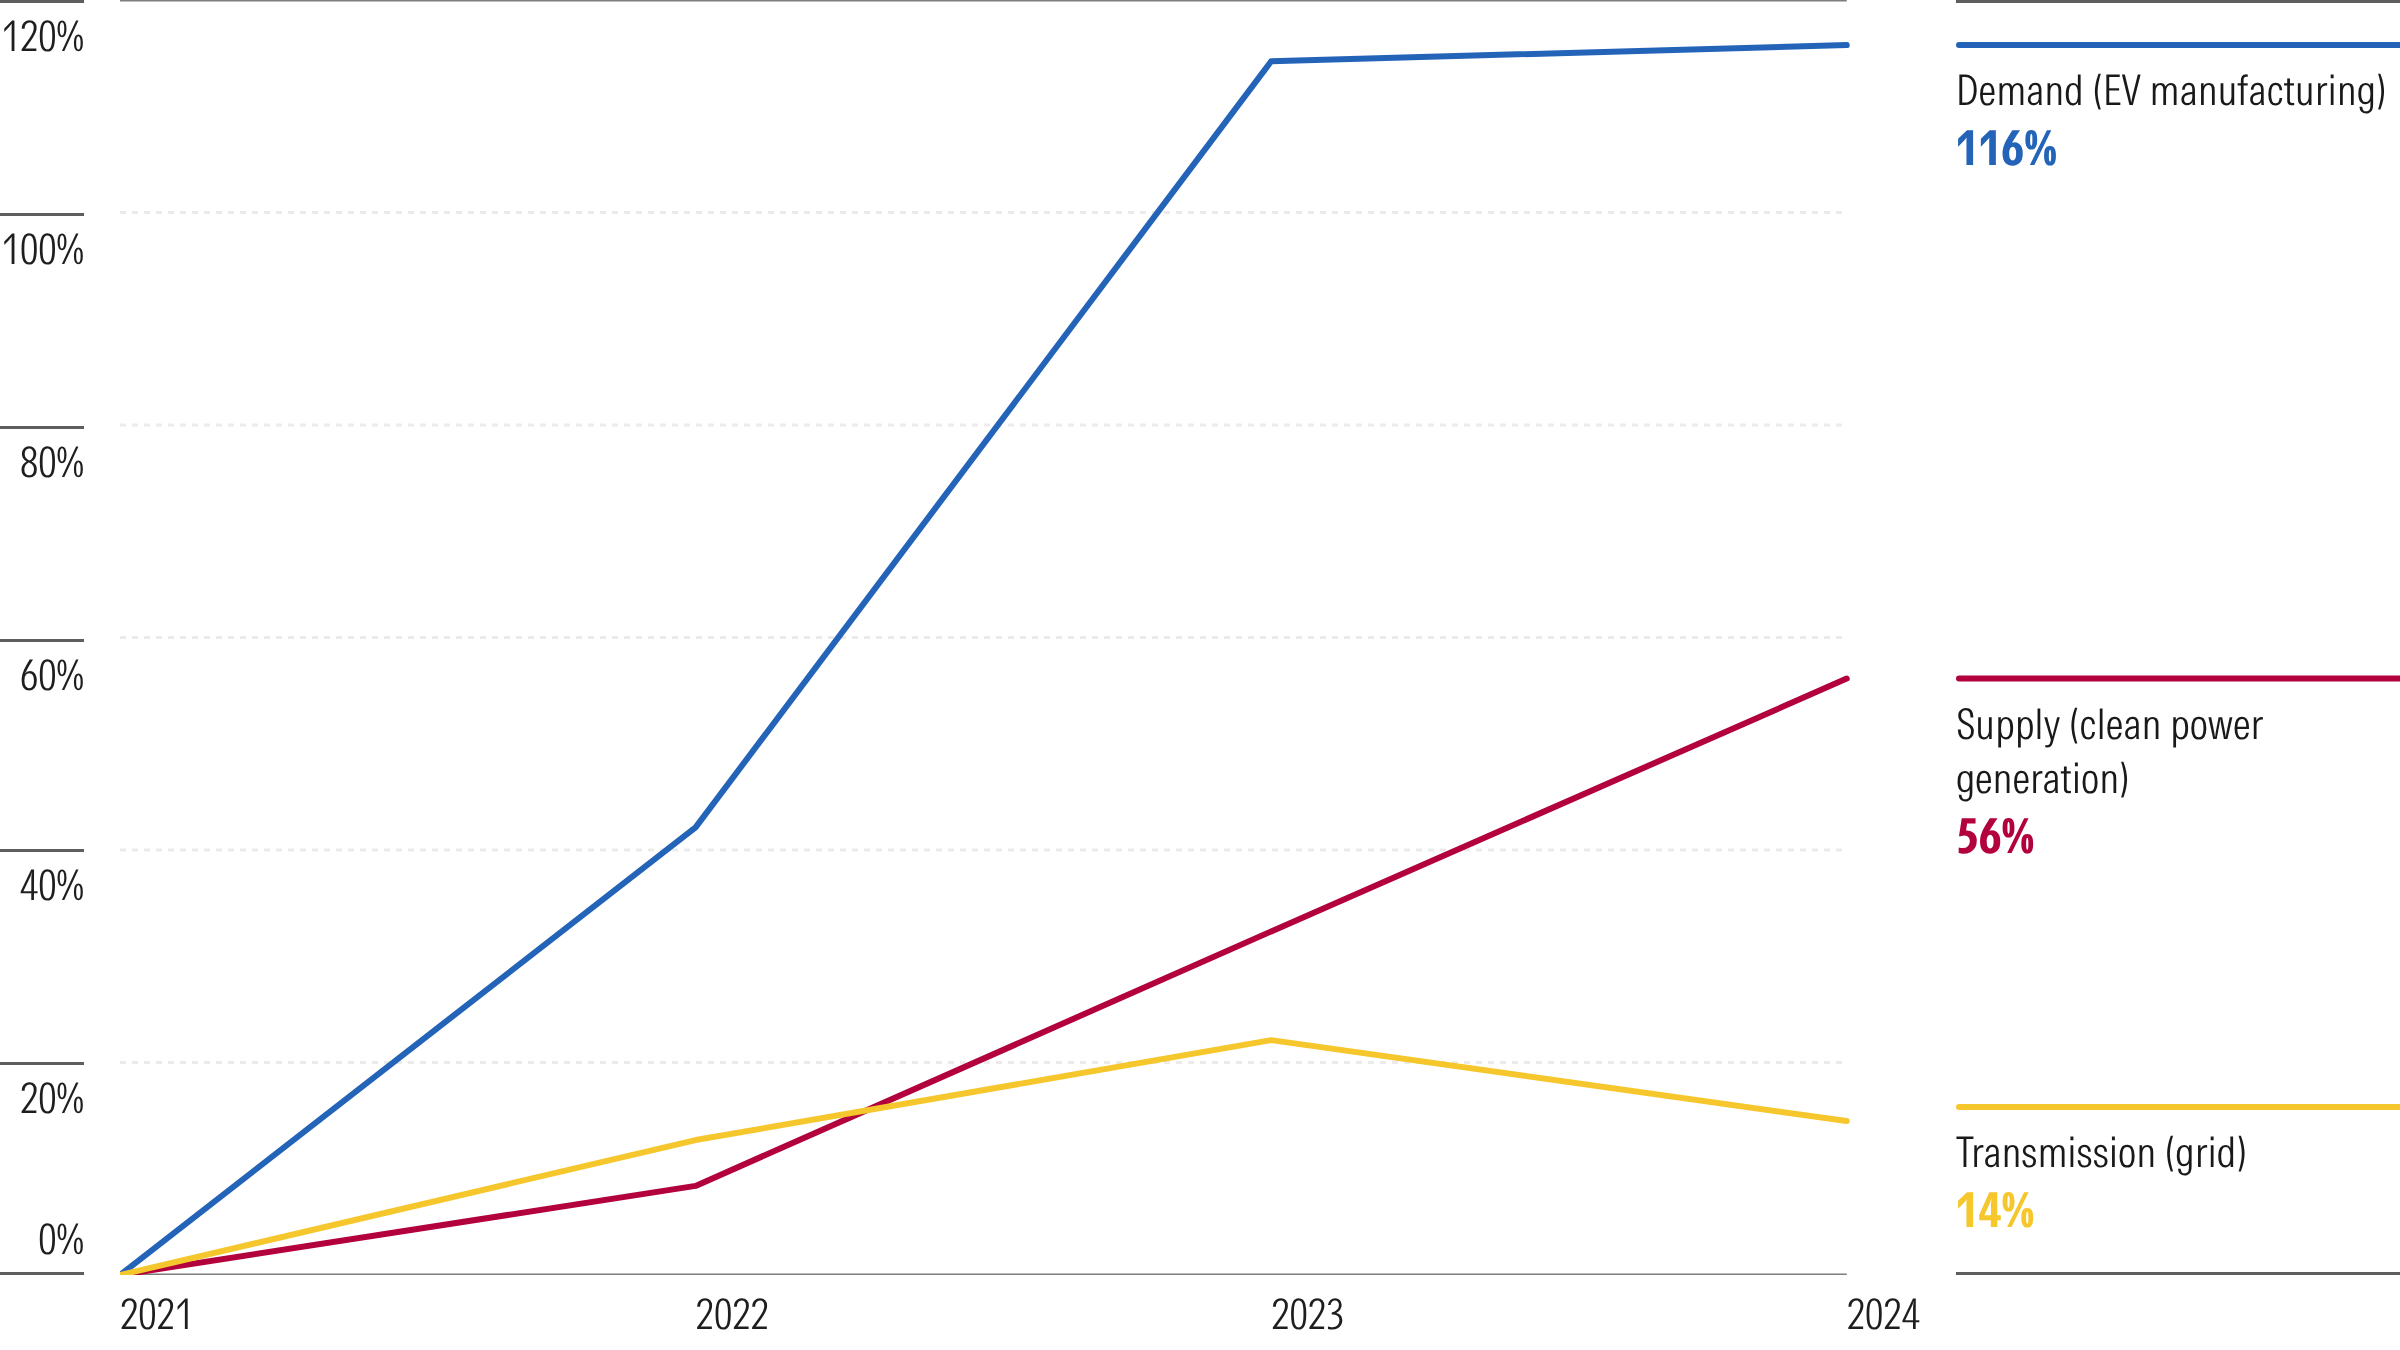
Our data show that this balance is slipping. Between 2021 and 2024, capex at the demand end (EV manufacturing) more than doubled, and supply capex (clean power generation) rose by more than half, but transmission capex rose by only about 14% (see Figure 3).
Figure 3. Global Electrification Capex in the Power System, 2021–2024 (% change since 2021)
Source: Morningstar Sustainalytics.
Note: Demand = EV manufacturing; supply = clean power generation (solar, wind, hydro, nuclear, geothermal); transmission = electricity transmission and distribution. Based on activity-level capex for about 2,400 listed companies in Morningstar Sustainalytics’ capex dataset.
The Slump in the Middle
The electrification system is being built faster at either end compared to the middle. Grids are the largest single destination for low-carbon capex, yet they are falling behind clean generation. As shown in Figure 3, transmission capex kept pace with clean generation in 2022 but fell behind from 2023 onward. In 2024, transmission dropped below its 2023 peak, while supply kept climbing. This left transmission 14% above its 2021 level against 56% for supply, a gap of 42 percentage points. Our data cover listed companies only, so unlisted state-owned grid investment is not captured, and total grid spending is likely higher. But because electricity supply and transmission are measured across the same companies, the gap between them is a like-for-like signal that grid investment is falling behind.
Because every unit of new renewable generation ultimately depends on network capacity to deliver electricity to consumers, this widening gap between supply and transmission capex provides a simple indicator of whether grid expansion is keeping pace with clean energy deployment. This relative lack of growth in transmission is becoming a bottleneck, as clean power cannot connect to end users fast enough to keep up with demand. This puts the 2035 electrification goal at risk. The challenge is no longer generating demand for electrification technologies or building renewable generation capacity. It is ensuring that grid infrastructure expands rapidly enough to connect the two.
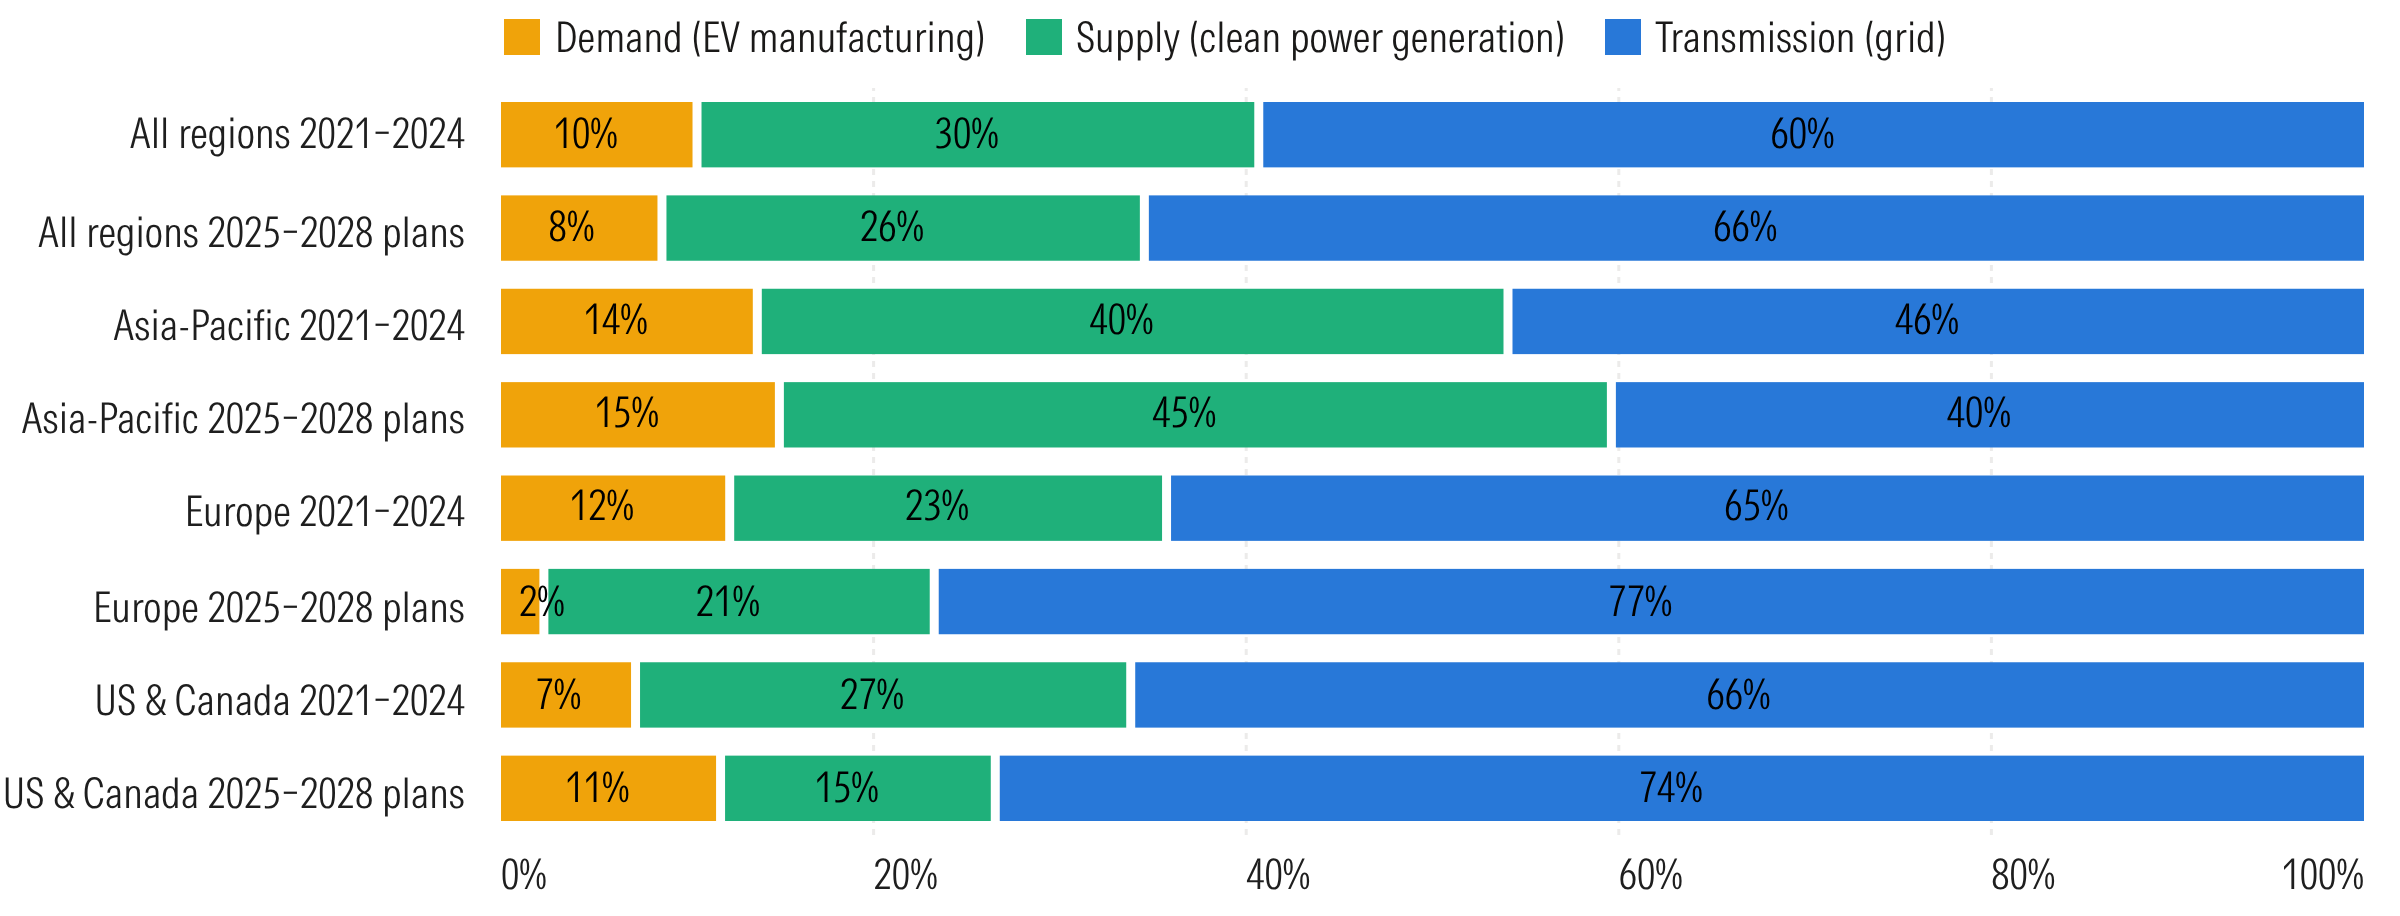
While historical grid investment falls short, the question now is whether planned spending in the future will close the gap. Figure 4 shows how capex is split between supply, grids, and demand, and compares spending between 2021 and 2024 with companies’ planned spending for 2025 to 2028. As plans for future years cover fewer companies, the change is indicative, rather than a forecast.
Figure 4. Electrification Capex by Power System Part and Region, 2021–2024 and 2025–2028 Plans (% of total)
Source: Morningstar Sustainalytics.
Note: Demand = EV manufacturing; supply = clean power generation (solar, wind, hydro, nuclear, geothermal); transmission = electricity transmission and distribution. 2025–2028 reflects capex plans disclosed by companies, which cover fewer companies than 2021–2024. Latin America and Africa/Middle East are included in “All regions” but not shown separately because of their small base. Based on activity-level capex for about 2,400 listed companies in Morningstar Sustainalytics’ capex dataset.
Grid Plans Suggest a Catch-up, but Are Uneven
Planned capex points to grids catching up in some regions, but visibility remains limited. As shown in Figure 4, transmission’s share of electrification capex across all regions rises from 60% in 2021–2024 to 66% in 2025–2028 plans. Regionally, that figure is projected to be about three-quarters in Europe, and in the US and Canada. Asia-Pacific’s plans tilt more toward supply as grid share falls from 46% to 41%. Note, though, that the region’s grid share is understated, as figures for China’s state-owned grid operators (which build most of the country’s network) are not included in our listed-company data.
The rising grid share may also partly reflect which companies disclose their capex plan, rather than a real shift in investment. According to our data, only a small share of companies disclose capex plans for electrification activities in 2027 and 2028, and grid operators are more likely than other companies to publish such long-term plans. A catch-up by grid investment therefore exists on paper, but it is uneven and hard to verify.
What It Takes to Reach COP31’s 35% Electrification Goal
Corporate investment in electrification is real, but it is concentrated rather than broad. To achieve COP31’s 35% electrification target, capital allocation needs to:
- Shift into the grid faster. Grid infrastructure already receives the largest share of low-carbon capex, but investment growth is not keeping pace with clean generation or EV manufacturing capex, and without stronger grids, new supply cannot reach users and demand cannot scale.
- Expand beyond solar. Solar dominates clean-generation investment, while wind, nuclear and hydro each account for a much smaller share.
- Move to replace, not just add. Clean investment needs to displace — not just sit alongside — existing fossil-fuel and combustion-engine investment.
- Pick up the pace in lagging regions. Investment remains heavily concentrated in Asia-Pacific, Europe, and North America, while Latin America and Africa/Middle East together account for only around one-tenth of all global electrification capex.
One practical outcome from COP31 would be to encourage more consistent forward-looking capex disclosure. Investors currently have some visibility into near-term spending plans, but little insight into how companies intend to deploy capital beyond the next few years. Disclosure by activity, by year, and in connection with transition plans, building on the capital deployment requirements of IFRS S2, would make it easier to assess whether corporate strategies are aligned with long-term climate goals. Targets will continue to define the ambition. Capex will show whether the 2035 goal is being funded, and whether supply, grids, and demand are growing together.
References
- COP31. 2026. COP31 Presidency announces “35% by 2035” electrification target as part of Action Agenda launch. June 9, 2026. https://cop31.tr/news-detail/bonn-electrification-target-2026.
- The Renewable Energy Institute. 2026. China Surpasses 2030 Renewable Energy Goals Years Ahead of Schedule. https://www.renewableinstitute.org/china-surpasses-2030-renewable-energy-goals-years-ahead-of-schedule/.
- IEA. 2026. Electricity 2026, IEA, Paris https://www.iea.org/reports/electricity-2026/executive-summary.