Navigating the climate transition requires comprehensive data that assesses both a company's low carbon ambitions and the actions it is taking to effectively align with a low carbon pathway.
Investors are looking deeper into the factors underlying the credibility of a company's transition plan to form their own tailored assessments.

Morningstar Sustainalytics’ flagship Low Carbon Transition Ratings (LCTR) provide the solution – empowering investors and financial institutions to allocate capital to companies taking genuine action to reach their low carbon goals.
Highly Versatile Dataset
The LCTR is an end-to-end solution combining granular issuer-level data, high-level directional metrics like Implied Temperature Rise (ITR), and sector level insights for portfolio analysis and reporting.
Company Action is a Priority
While most research on the market focuses on companies’ low carbon ambitions, the LCTR assesses a company’s alignment with external standards, its future vulnerability from a shift to a low carbon economy, and the actions it is taking to manage transition risk.
Comprehensive Company Assessment
By looking both at stated targets and beyond, LCTR shows not just where companies say they're going - but whether their actions are in line with their goals. They surface two complementary signals: Performance-based Implied Temperature Rise (ITR), which projects a company's decarbonization trajectory based on a company's current practices, management actions and allocated CAPEX, and its Ambition Temperature, which models outcomes if stated targets are achieved. Together, they provide a multi-dimensional assessment of both trajectory and intent across the value chain.
Experienced and Dedicated Team
The LCTR’s unparalleled insights build on Morningstar Sustainalytics’ 30-year history of assessing management risks. Each analysis is developed by a team of 120 professionals and specialists, offering over 200 data points for every company in our universe of over 10,000 issuers across various low carbon scenarios. This includes the UN PRI IPR Required Policy Scenario, IEA Net Zero 2050 Scenario, UN PRI IPR Forecast Policy Scenario, and the IEA Stated Policies Scenario.
Deep Insight into Transition Plan Credibility
This gives LCTR users maximum transparency into the credibility of a company’s transition plans and management preparedness, making it easy to integrate granular insights into all stages of the investment process and map companies or funds to globally accepted frameworks like IIGCC’s NZIF 2.0.
Our Experts Are Ready to Help You
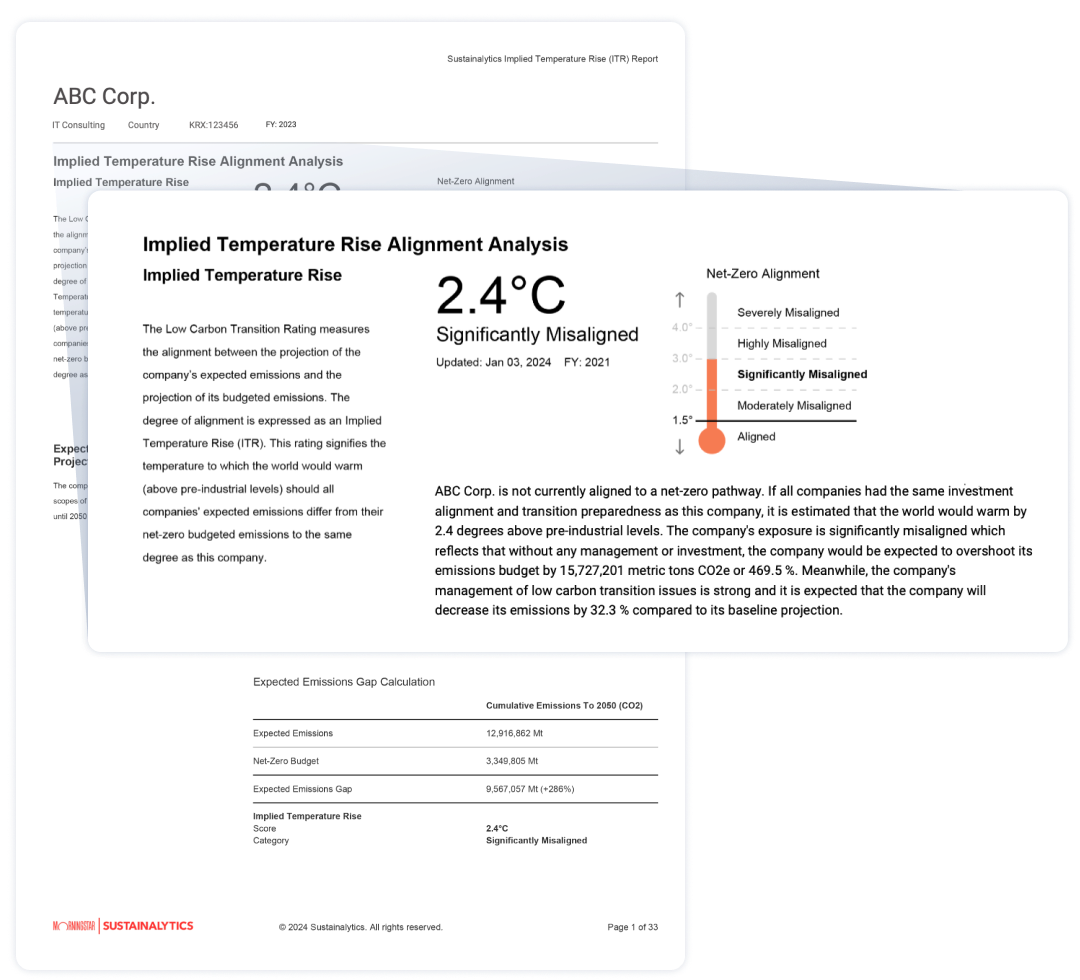


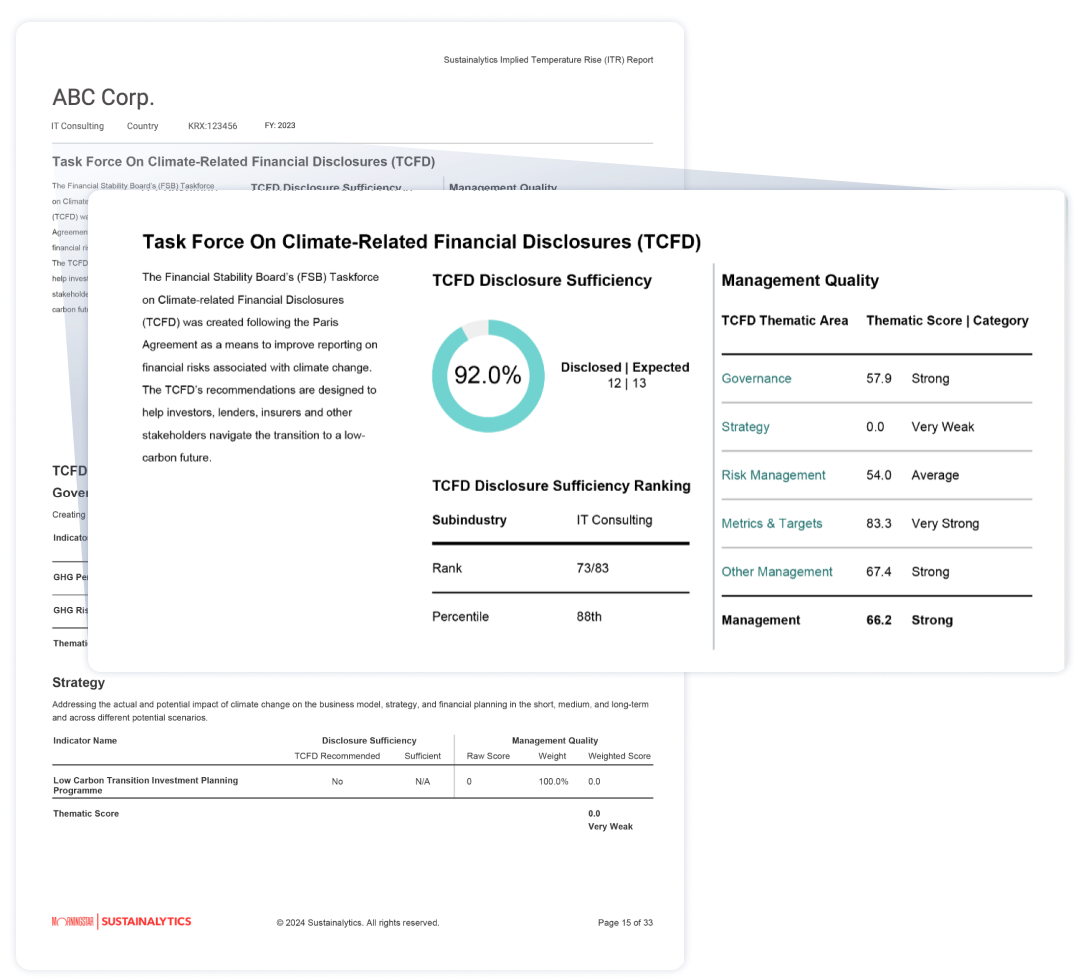
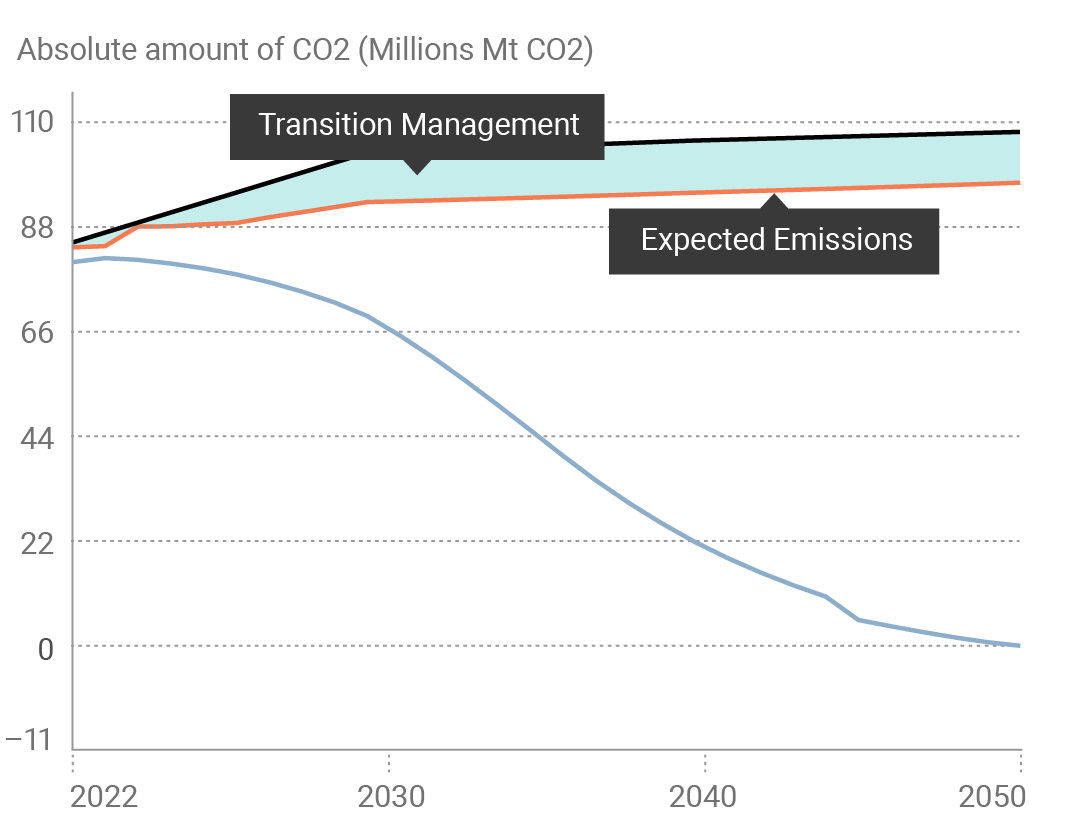
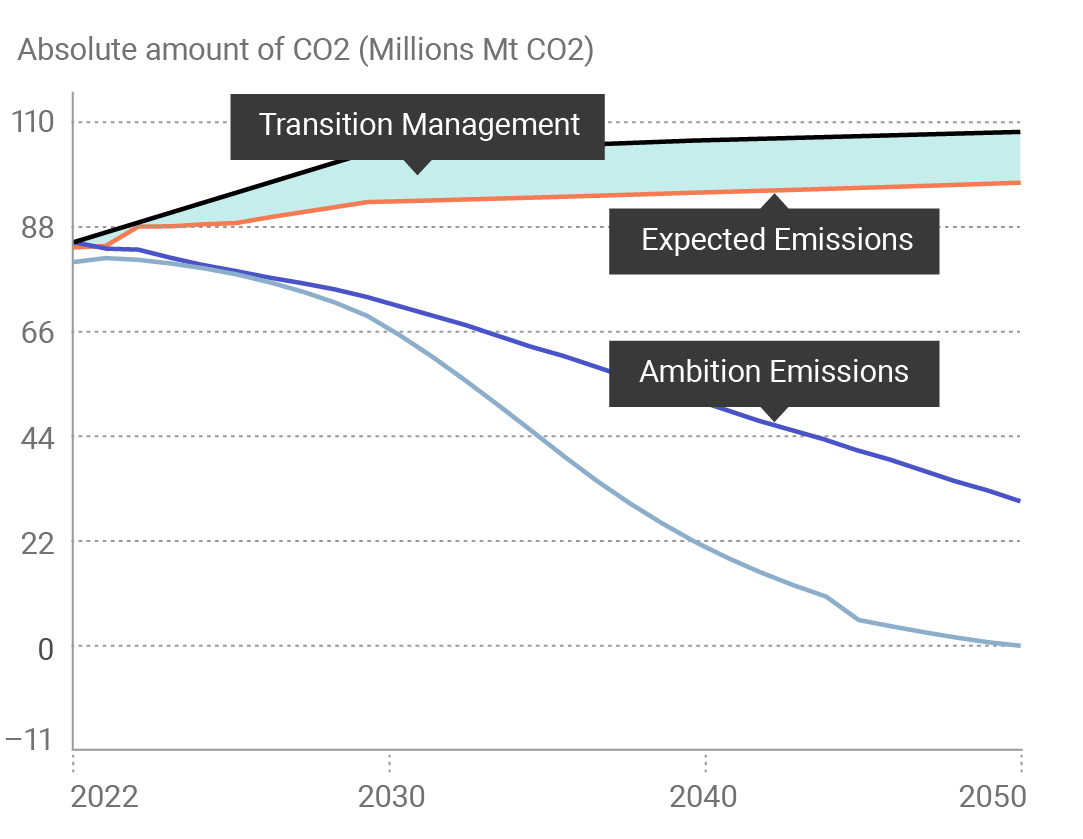
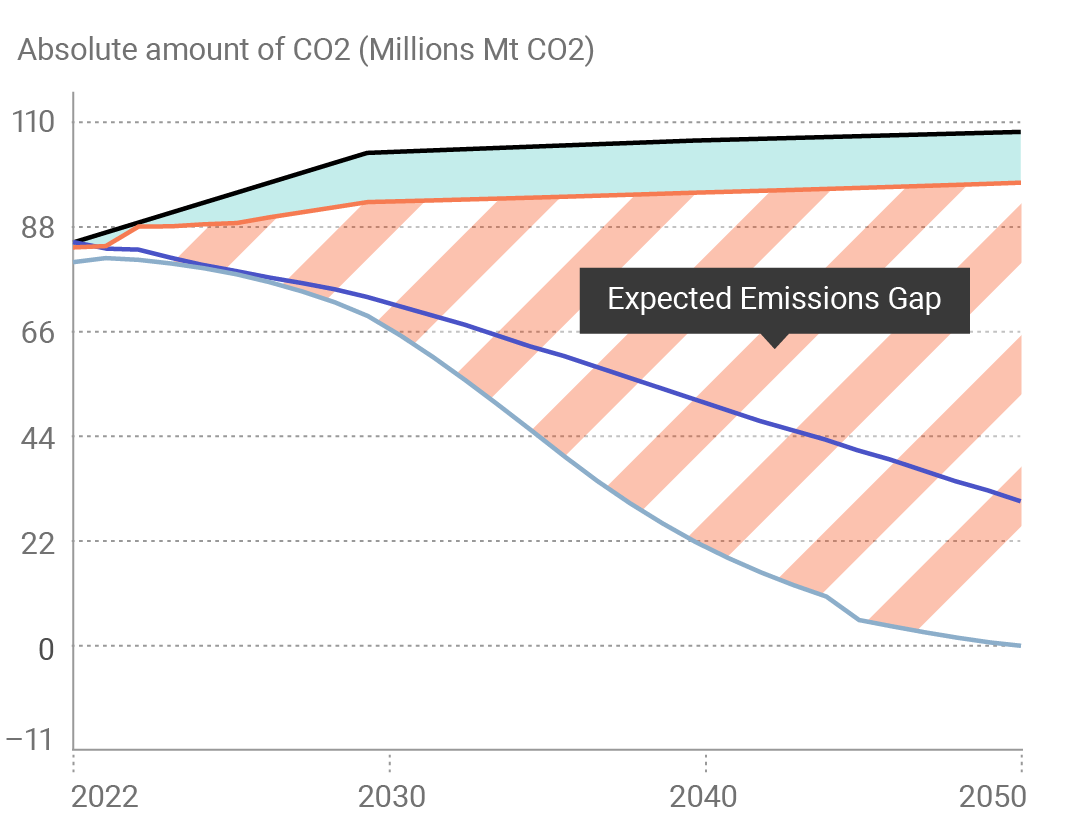
Morningstar Sustainalytics' performance-based Implied Temperature Rise (ITR) provides a comprehensive measure of low carbon transition exposure and management preparedness. We do this by analyzing a company’s expected alignment to a low carbon pathway and its management actions to reduce emissions.
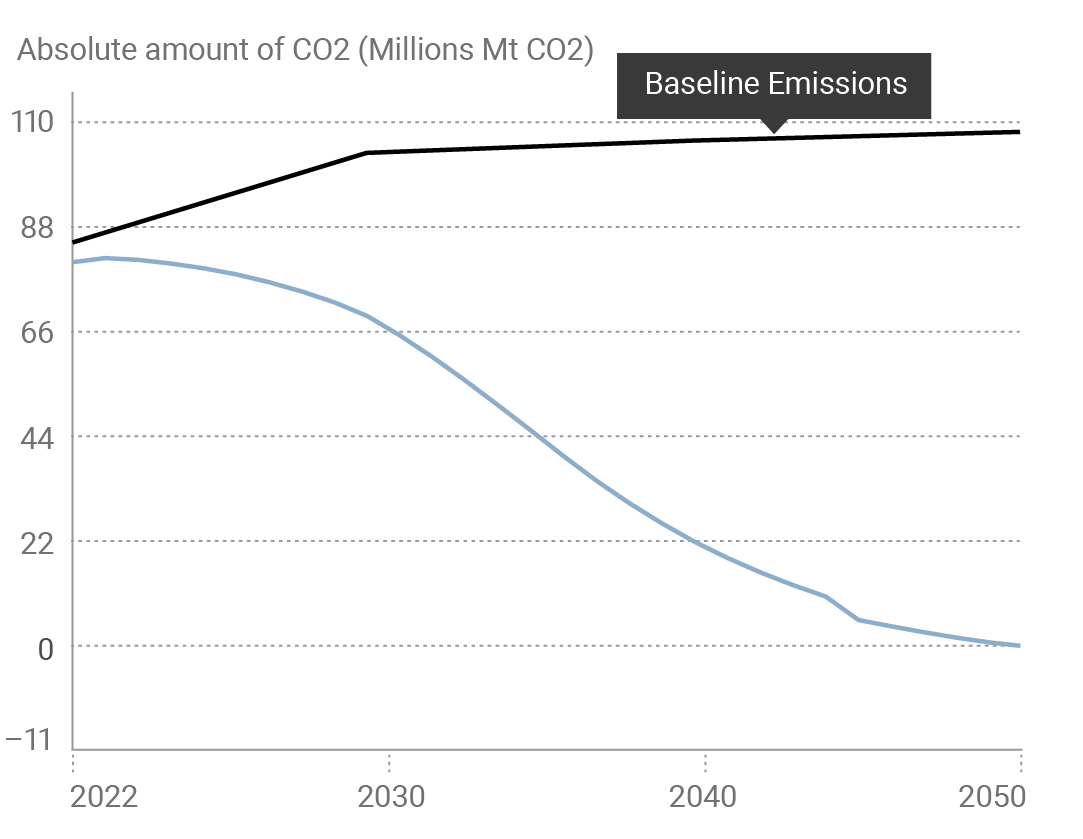
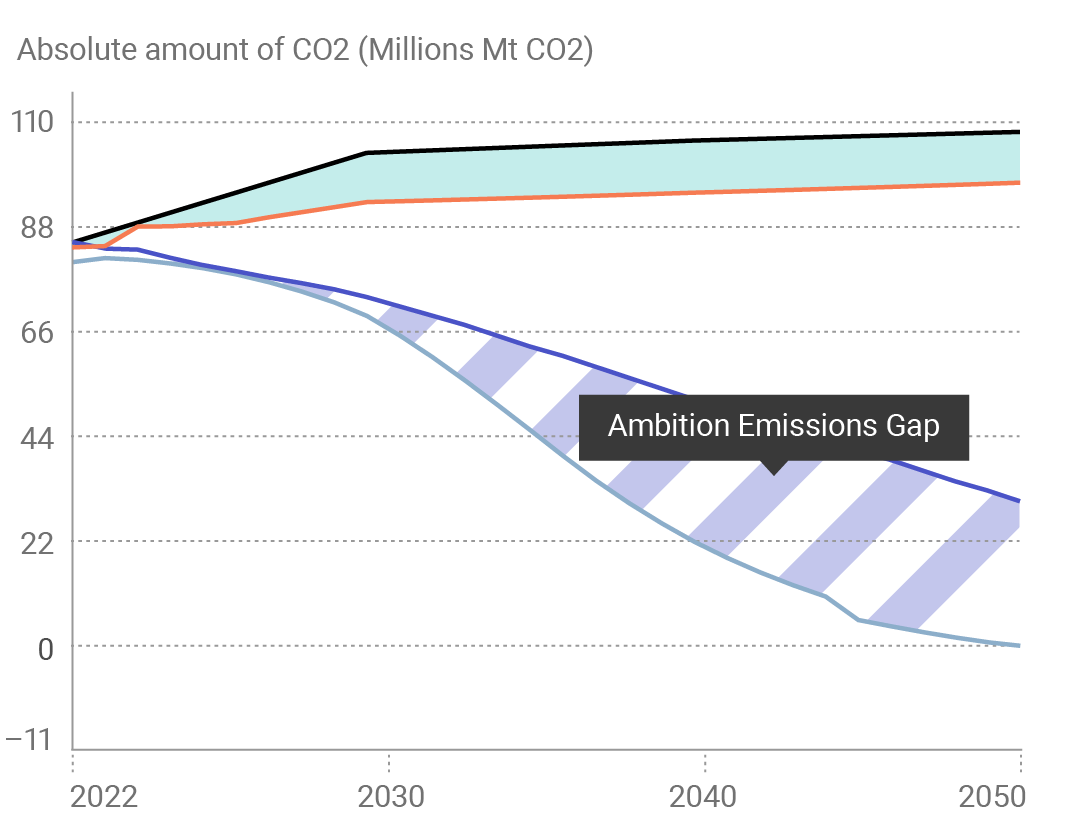
The Ambition Temperature Alignment calculates a company’s expected alignment to a low carbon pathway based on its stated emissions reduction targets (if available).
Here's how we create the performance-based ITR and Ambition Temperature Alignment:
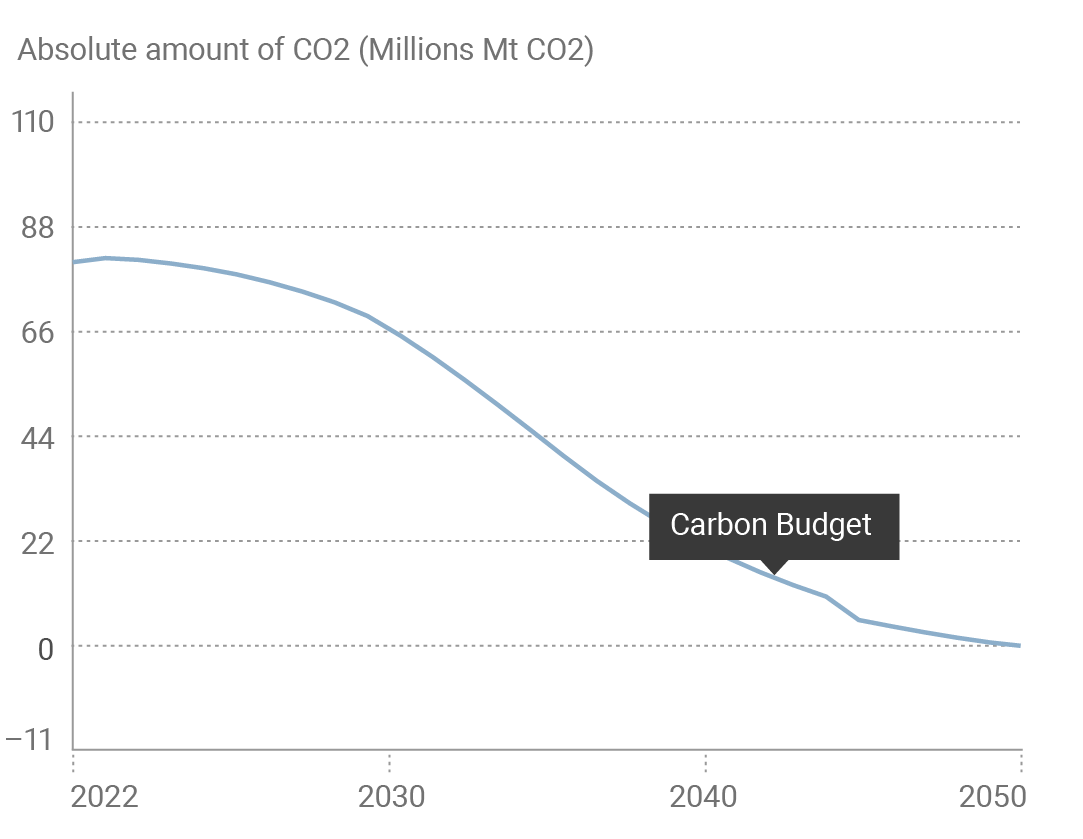
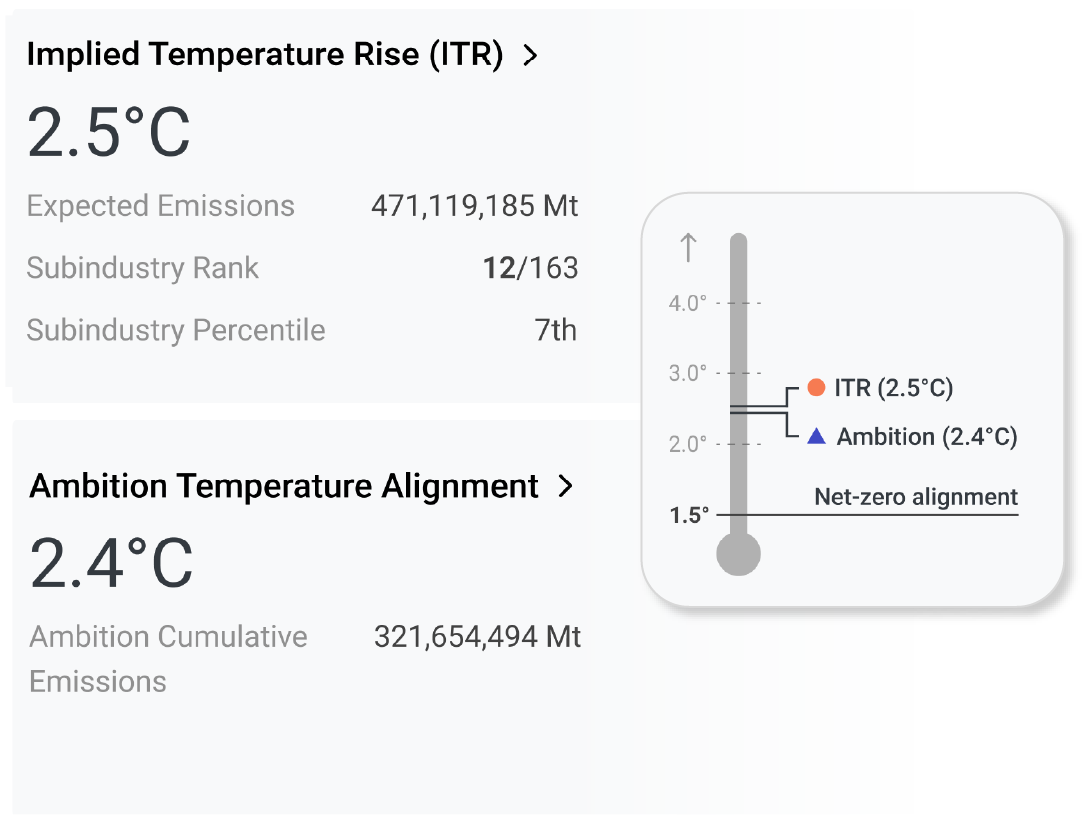
We also calculate the global temperature increase in 2050 if the global economy exceeds its low carbon budget by the margin of the company's Ambition Emissions Gap, resulting in the final Ambition Temperature Alignment.
This enables you to assess how well a company's expected alignment to a low carbon pathway from current management actions matches their stated emissions reduction targets.
Global Access Clients
Access our ratings using Morningstar Sustainalytics' screening and reporting tools.
Data Services Access
Integrate LCTR into your preferred internal system through our FTP or API services.
Monitoring Systems
Ratings are available via Morningstar Direct, MPS, and Data Feeds.
Third Party Systems
Ratings are currently in Snowflake and will soon expand to FactSet, Aladdin, and Bloomberg.