
By 2050, physical climate change could reduce GDP by up to 25% in some regions.1 The effects of climate change are being widely felt, and both transition and physical risks are increasingly more material across sectors and regions.
Morningstar Sustainalytics’ Physical Climate Risk Metrics help investors understand their direct and indirect exposure to physical climate change, and the potential financial impacts to their portfolio companies.
With coverage on over 12 million assets, investors can leverage Physical Climate Risk Metrics to manage their portfolio exposure, fulfill reporting requirements, and prioritize topics and companies for engagement activities.
Latest Insights


Managing Risks for a Changing Climate: A Guide for Institutional Investors

What is Physical Climate Risk?
Physical climate risks are the damages and losses to property that occur due to the physical consequences of climate change. These physical risks result from acute climatic events, such as flooding, wildfires and extreme heat, and chronic climatic events like droughts and coastal inundation.
Physical climate risks are unevenly distributed across countries and regions, and over time, so locations that are at low risk today may have much higher risk in the future. Across the business value chain, physical climate risks can have direct impacts, like impairment costs and productivity loss, and indirect impacts that can disrupt supply and demand. All of these can have an impact to the investor, such as a change in earnings or an increase in default risk.
Respond to Regulatory Requirements
Disclose company-level physical climate risk data to voluntary and mandatory reporting bodies, as well as clients looking for climate change-aligned investment products.
Insights Into Financial Risks
Physical Climate Risk Metrics offer visibility into the financial impacts of physical climate risks, considering a company’s revenue, physical asset value, and operating cash flow.
Covering the Full Business Value-Chain
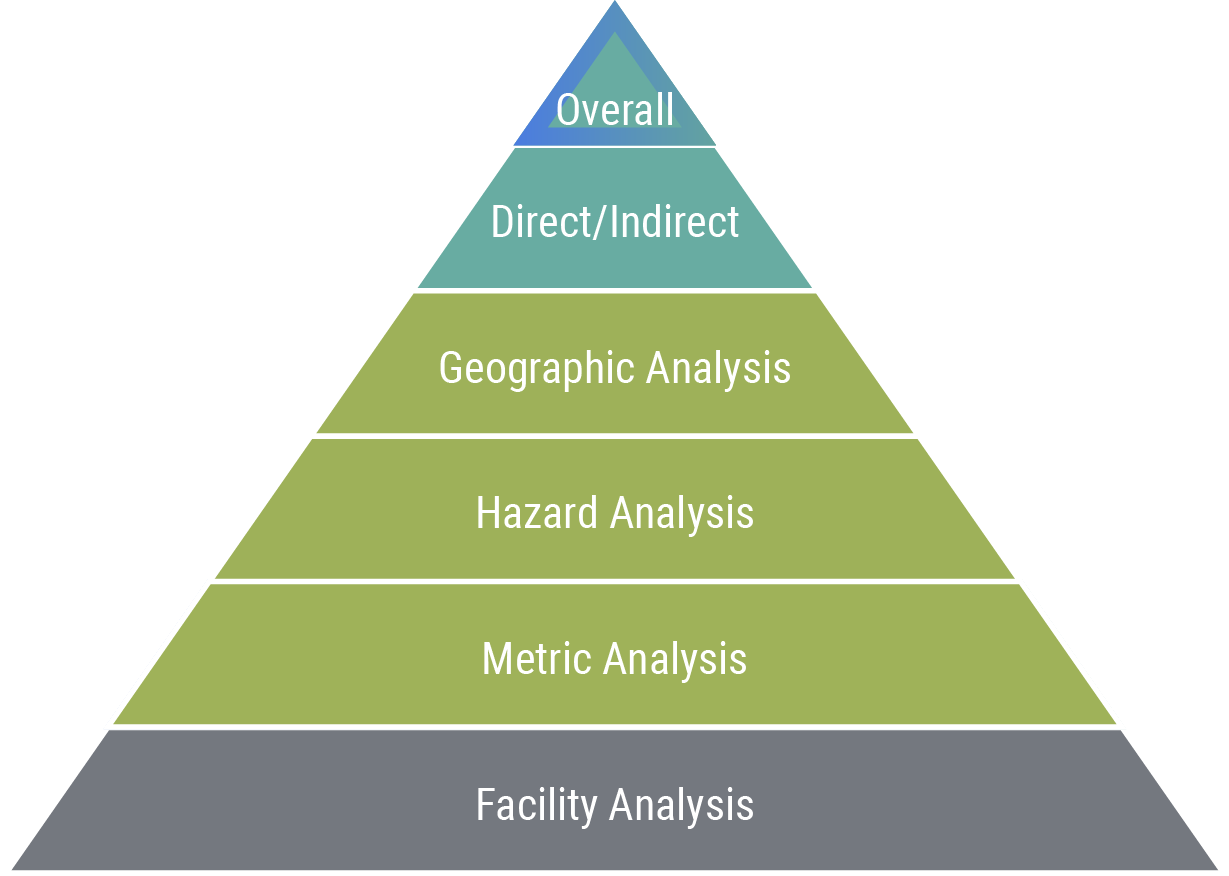
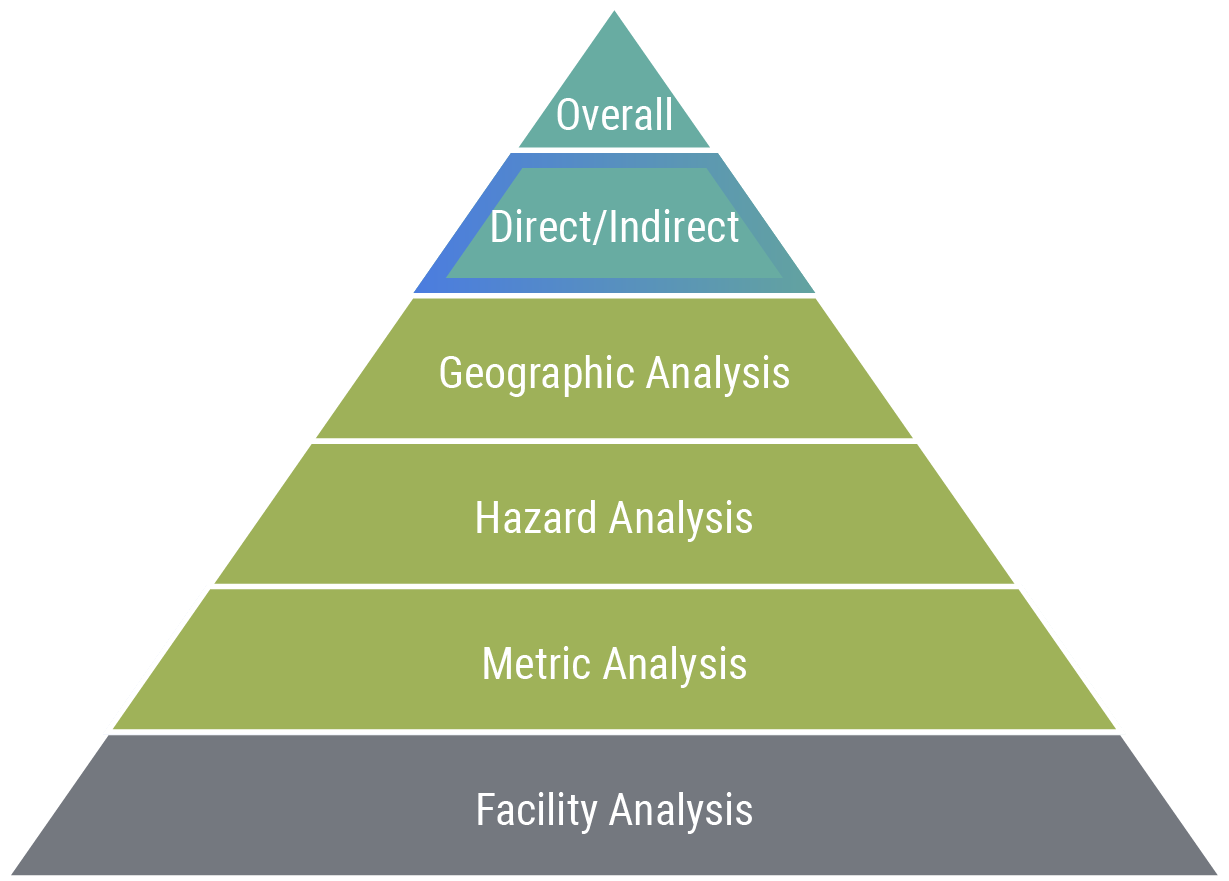
Direct and indirect exposure metrics are calculated as separate signals, aligning with the Task Force for Climate-related Disclosures (TCFD) recommendations, and roll-up to a single overall exposure signal.
Comparable Metrics for Peer Analysis
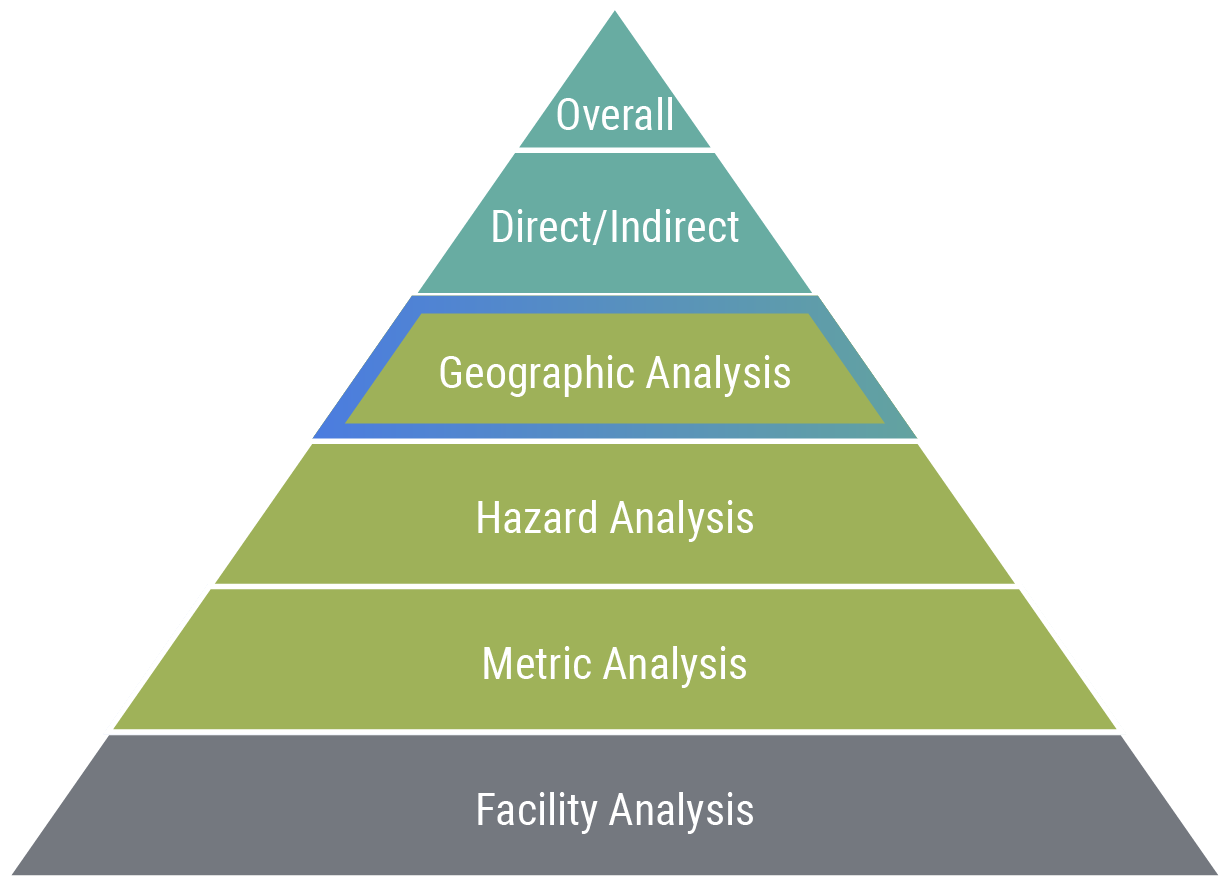
Easily compare a company’s exposure to physical climate hazards across different industries, geographies, short and long-term time horizons and climate change scenarios.
Industry Expertise
Sustainalytics collaborated with XDI, an award-winning global leader in physical climate risk analysis on companies and their assets, to create these metrics.
Perform Scenario Analysis
Investors can assess their exposure to physical climate risks by analyzing a company’s projected financial losses and financial capacity to absorb losses, based on a company’s owned or leased global assets.
Comprehensive Issuer & Asset Coverage
Physical Climate Risk Metrics offer a bottom-up assessment of physical climate risks, covering 12 million assets, 135 sectors and 235 countries.
Unparalleled Data
The rich data underpinning our exposure assessment spans multiple lenses, including hazards, countries, loss amounts, time series, climate scenarios and the quality of company asset-level data.
Assessment of Expected Financial Losses
Multiple financial metrics and data points provide investors with direct inputs for Value-at-Risk modelling based on direct and indirect physical climate risks.
Multiple Report Views
Company profiles in Global Access include interactive graphs, web-based reports and data visualizations to help investors visualize the extent of their exposure to physical climate change. Plus, five standard reports are delivered through Sustainalytics’ Data Services or API.
Geographic & Hazard Coverage
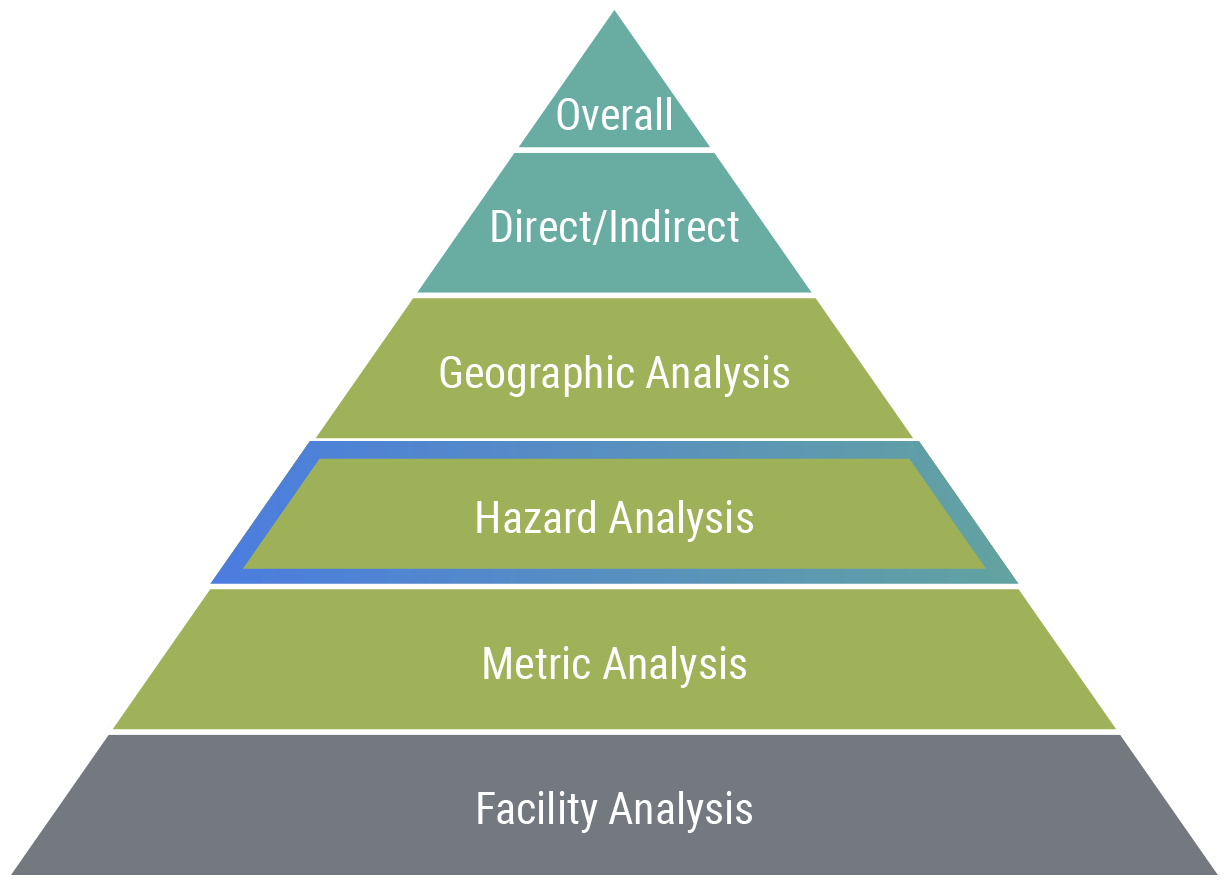
The metrics incorporate global modelling of the future probability and severity of 8 hazards: coastal inundation, extreme heat, extreme wind, flooding, forest fire, freeze-thaw, soil subsidence, and cyclone wind.
1 Swiss Re Institute. 2021. “The economics of climate change: no action not an option,” April 2021. https://www.swissre.com/dam/jcr:e73ee7c3-7f83-4c17-a2b8-8ef23a8d3312/swiss-re-institute-expertise-publication-economics-of-climate-change.pdf
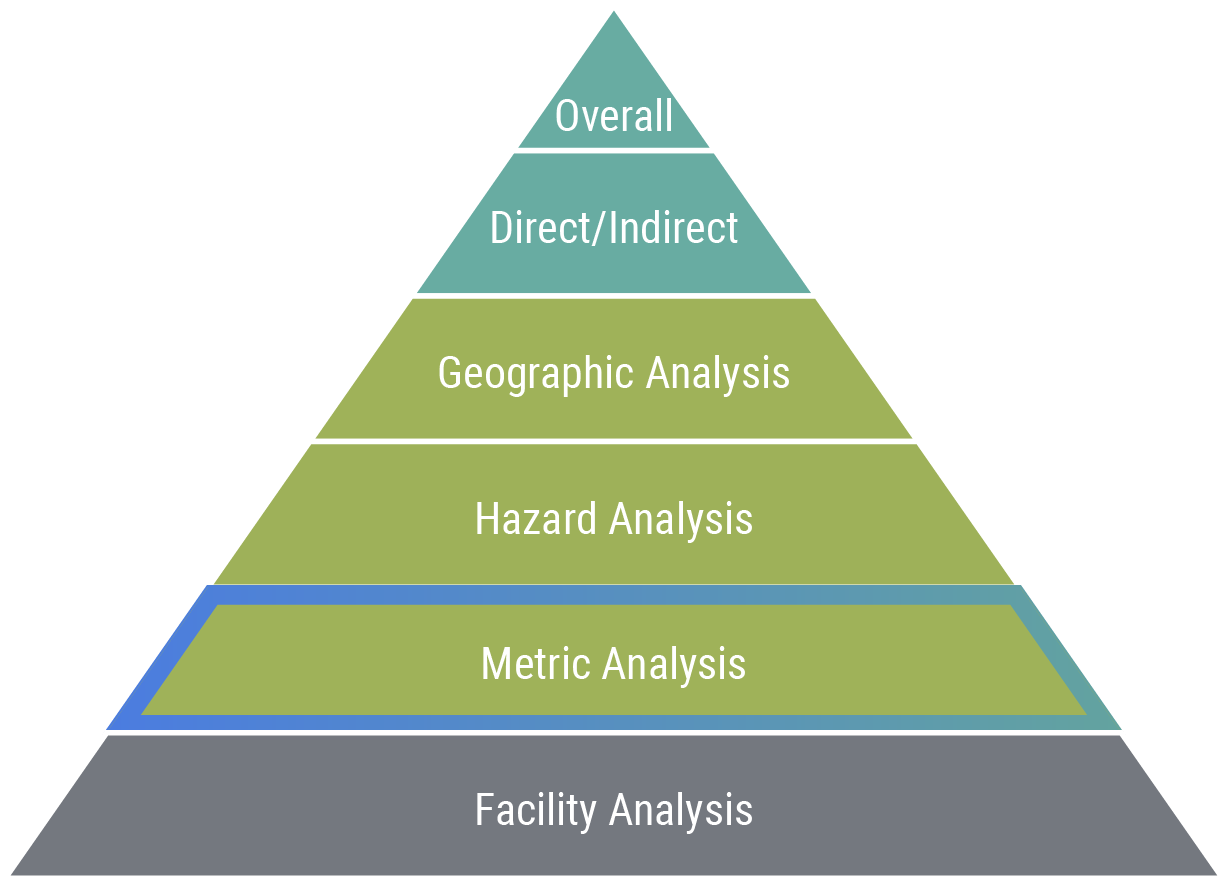
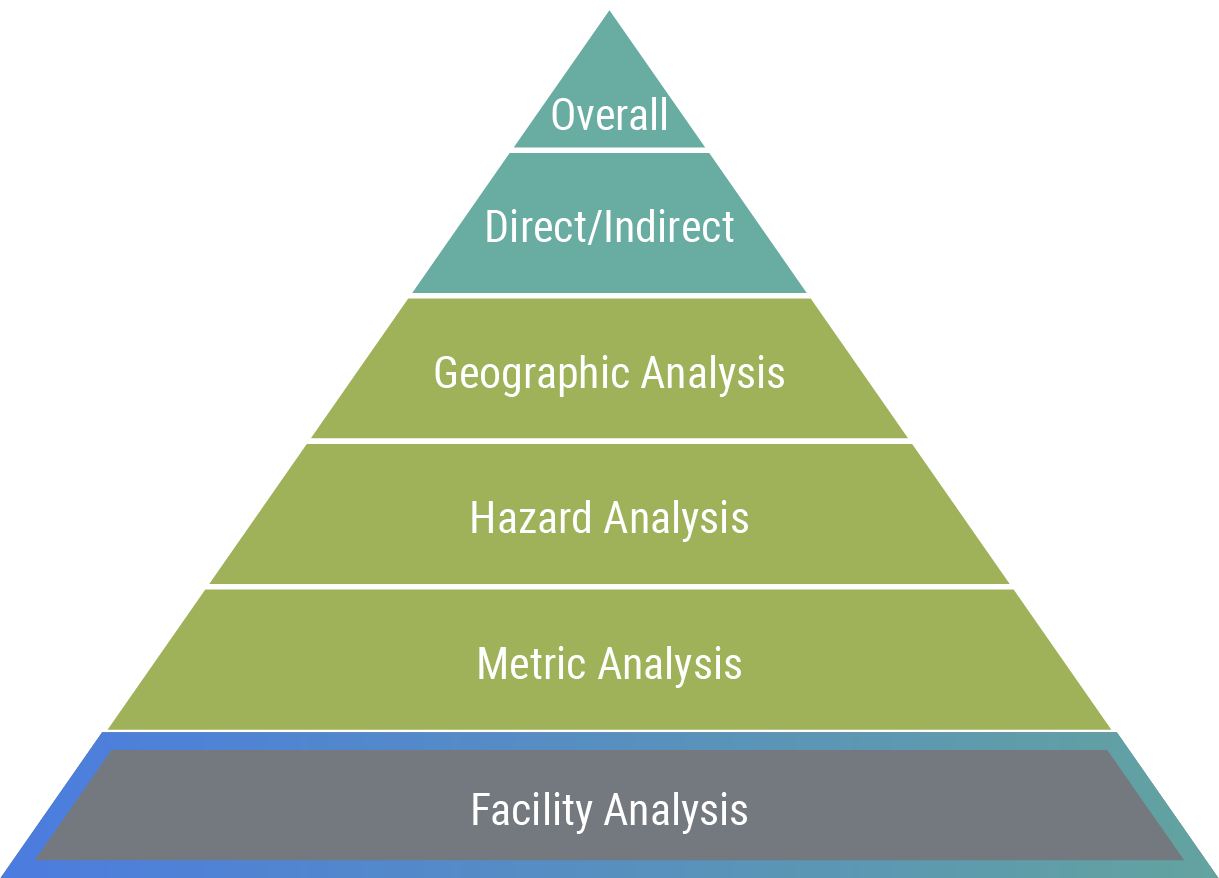
How We Measure Physical Climate Risk
Sustainalytics Physical Climate Risk Metrics help investors evaluate the companies in their portfolio and determine which ones have greater exposure and expected losses due to physical climate risks.
Use Cases
Climate Reporting
Support TCFD-aligned disclosures on direct and indirect physical climate risk, and report to clients on how portfolio companies are exposed to physical climate risks.
Research
Assess how the exposure and vulnerability of a broad universe of global companies could change under two climate scenarios and over short and long-term time horizons.
Engagement
Evaluate company exposure to physical climate risks and identify priority topics for engagement, such as mitigation or adaptation strategies, hazard vulnerability and geographic exposure.
Portfolio Screening and Benchmarking
Assess a company’s relative exposure and vulnerability to direct and indirect physical climate risks compared to its peers. Screen investable universe based on company exposure to physical climate risks.
Scenario Analysis
Conduct forward-looking scenario analysis of expected losses due to physical climate risks across two climate change scenarios.
Why Sustainalytics?
A Single Market Standard
Consistent approach to ESG assessments across the investment spectrum.
Award-Winning Research and Data
Firm recognized as Best ESG Research and Data Provider by Environmental Finance and Investment Week.
End-to-End ESG Solutions
ESG products and services that serve the entire investment value chain.
30 Years of ESG Expertise
800+ ESG research analysts across our global offices.
Related Products

Climate Solutions
Identify and manage investment risks and opportunities with climate research, ratings and data for investors.
Learn More
Low Carbon Transition Ratings
Receive a forward-looking assessment of a company’s current alignment to a net-zero pathway.
Learn More
Carbon Emissions Data
Evaluate and analyze companies’ GHG emissions across scope 1, 2, and 3 emissions.
Learn MoreRelated Insights and Resources

AssetTV Partner Sustainable Investing Masterclass | Climate Investing in 2026: From Ambition to Real-World Impact
This Masterclass reveals how leaders leverage granular data and engagement to drive real-world outcomes. Master the strategies, governance, and transparency required to excel in an increasingly complex market.

Webinar Replay | ESG Resilience in Focus: How Markets Price Risk and What It Means for Portfolios
In this dynamic discussion, our research team explored the findings our research to provide insight into how sustainability risk is priced across markets, and how to interpret those signals to build more resilient portfolios.