Investors are facing increasing pressure to manage climate-related risks in their portfolios and fulfill disclosure requirements, such as the Task Force on Climate-related Financial Disclosures (TCFD) and EU Action Plan. As a result, investors are looking for companies to demonstrate their resiliency to climate risks with strong governance and management preparedness.
Responding to these market dynamics and with input from our institutional clients, Morningstar Sustainalytics spent the last 18 months developing its next generation climate ratings: Sustainalytics’ Low Carbon Transition Ratings. The Low Carbon Transition Ratings offer investors a forward-looking assessment of a company’s current alignment to a net-zero pathway.
Learn more about our Low Carbon Transition Ratings
Below is more information about our Low Carbon Transition Ratings, as well as additional resources.
You can now view your company’s rating by logging in to Sustainalytics’ Issuer Gateway, our dedicated ESG research portal for companies. To access your company’s rating:
Log in using your credentials at the link below, then navigate to the Research column on the left.
Here you can view the top-level summary of your company’s rating.
Click Explore More and navigate to Low Carbon Transition Rating to view the full report.
If you have any questions in the meantime, please contact our Issuer Relations Team.
Overview of Sustainalytics’ Low Carbon Transition Ratings
Our comprehensive framework measures the degree to which a company’s projected greenhouse gas (GHG) emissions differ from a net-zero pathway between now and the year 2050. The ratings leverage a two-dimensional framework that measures an issuer's exposure from their expected emissions, while also accounting for management actions. They assess the company's progress toward their stated net-zero commitments by evaluating the quality and ambition of their GHG reduction targets, as well as any demonstrated short-term investment plans, policies and programs.

About Our Framework

We start with a baseline projection, which is based on corporate reporting and estimation modelling across all 3 scopes of emissions, including both the upstream and downstream segments of scope 3.

Next, we consider how the quality of the company's policies and programs, strategy, governance, and financial position affect the baseline emissions.

This emissions projection is based on a company's baseline emissions in combination with their managed emissions.

This is the company's sector- and region-specific budget required to align to a net-zero emissions pathway by 2050.

The Expected Emissions Gap reflects the emissions that are not managed and indicates the severity of misaligned emissions.


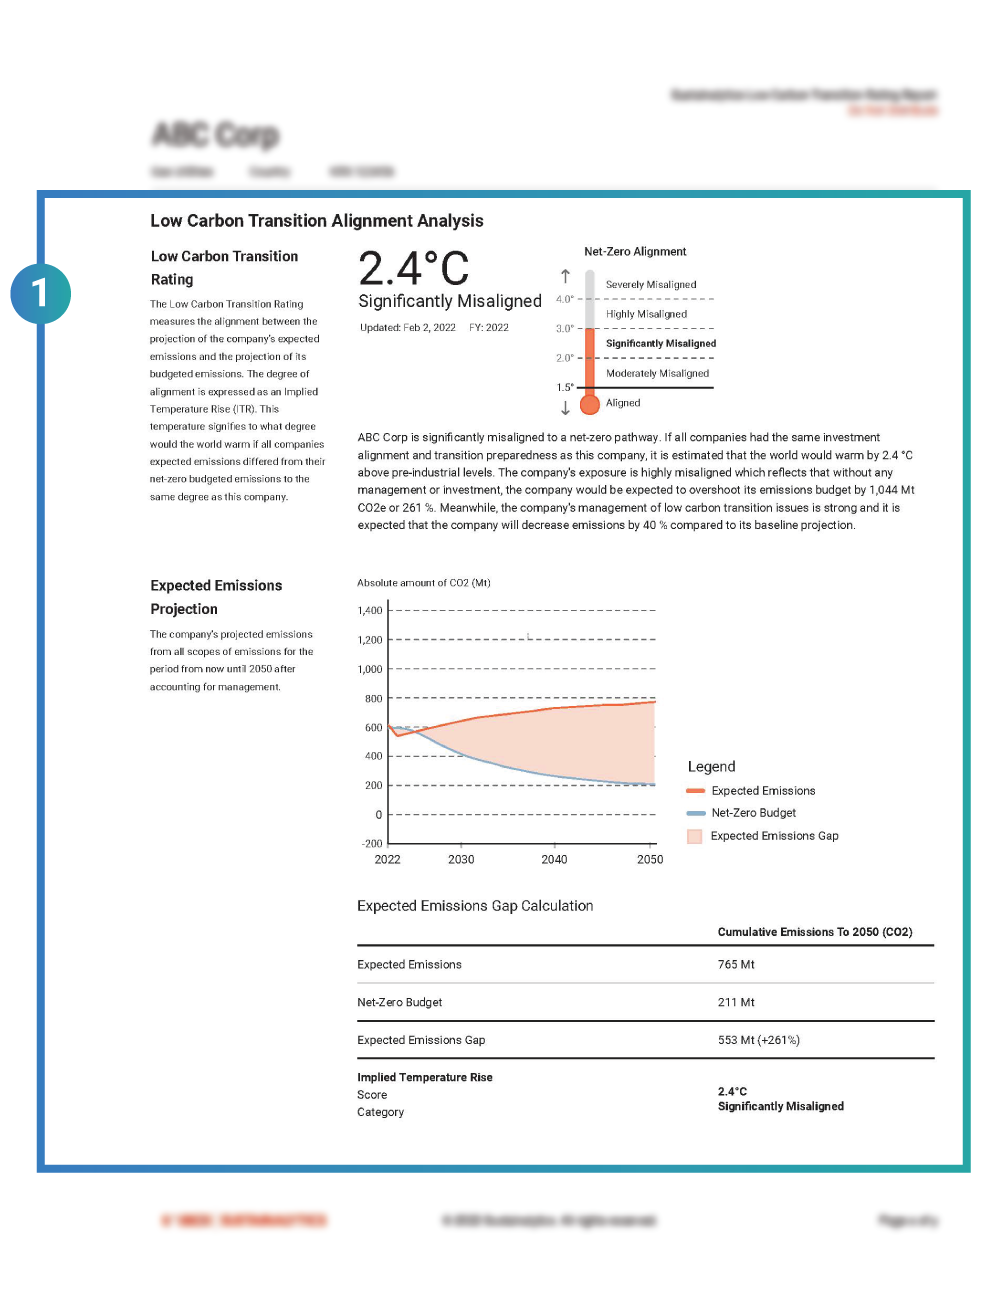
Expected Emissions Gap Calculation
| Cumulative Emissions to 2050 (CO2) | |
|---|---|
| Expected Emissions | 765 Mt |
| Net-Zero Budget | 211 Mt |
| Expected Emissions Gap | 553 Mt (+261%) |
| Implied Temperature Rise Score | 2.4ºC |
| Implied Temperature Rise Category | Significantly Misaligned |
Report Insights
A company’s top-level rating is expressed as an Implied Temperature Rise signifying the expected level of global warming if the global economy had the same proportion of emissions misaligned to the net-zero budget. The absolute emissions gap across each scope of the company’s business activity are summarized through time series graphs, with the underlying components of the assessment illustrated in decomposition charts.
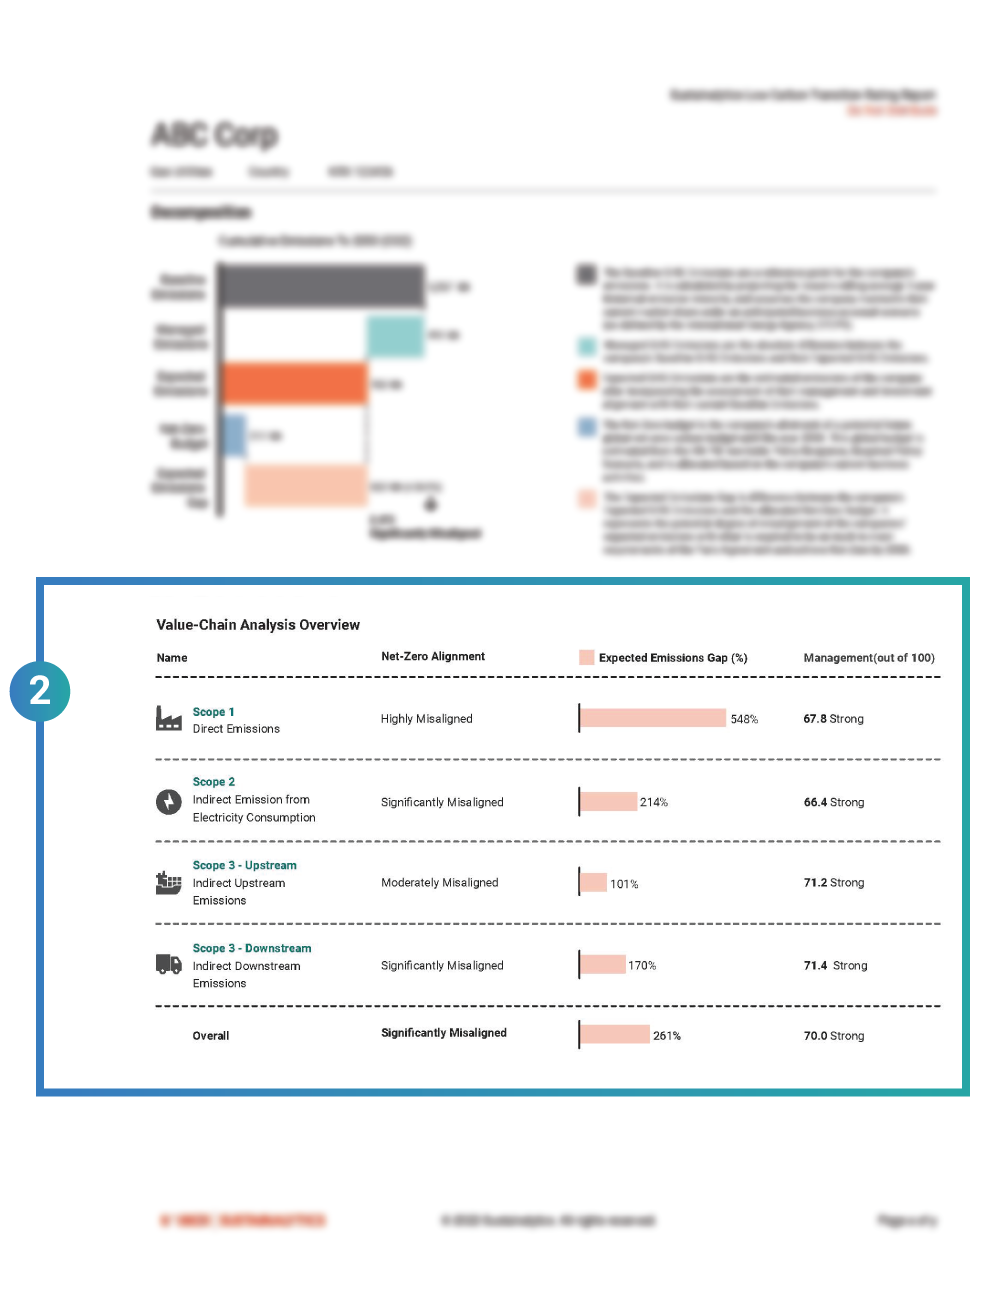
The degree of overall alignment to the net-zero budget is summarized for each scope of emissions across an issuer’s value-chain, providing transparency into how much each scope of emissions is contributing to the overall rating. A separate value-chain analysis for each of the exposure and management components is also provided.
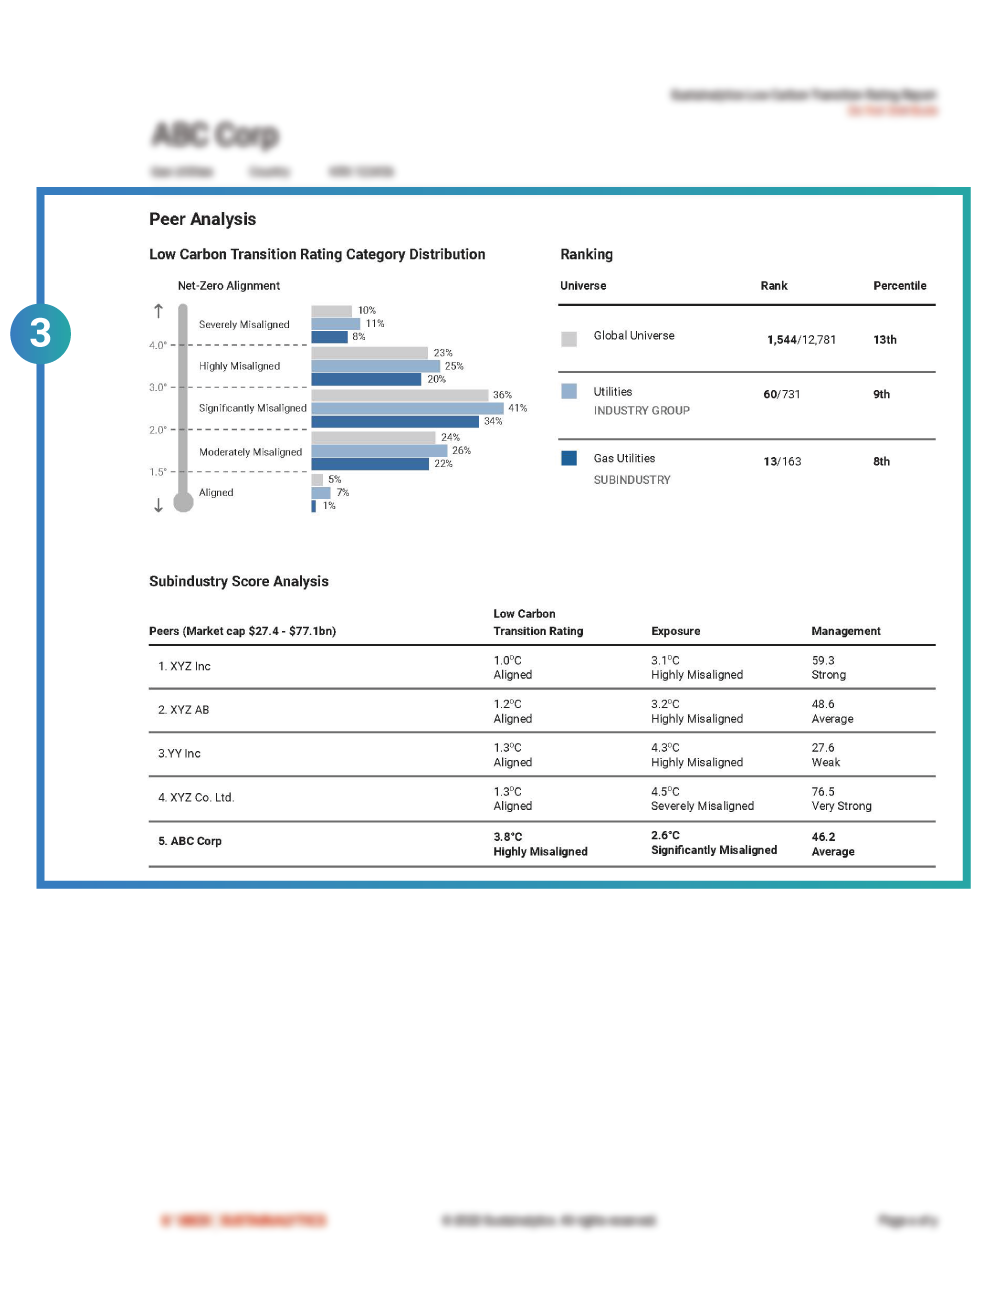
The issuer’s rating is analyzed in context of their peers in global public equity and bond markets, as well as industry and sub-industry specific peers. The issuer’s top peers by market capitalization are summarized with a view of their overall rating, Exposure and Management scores.
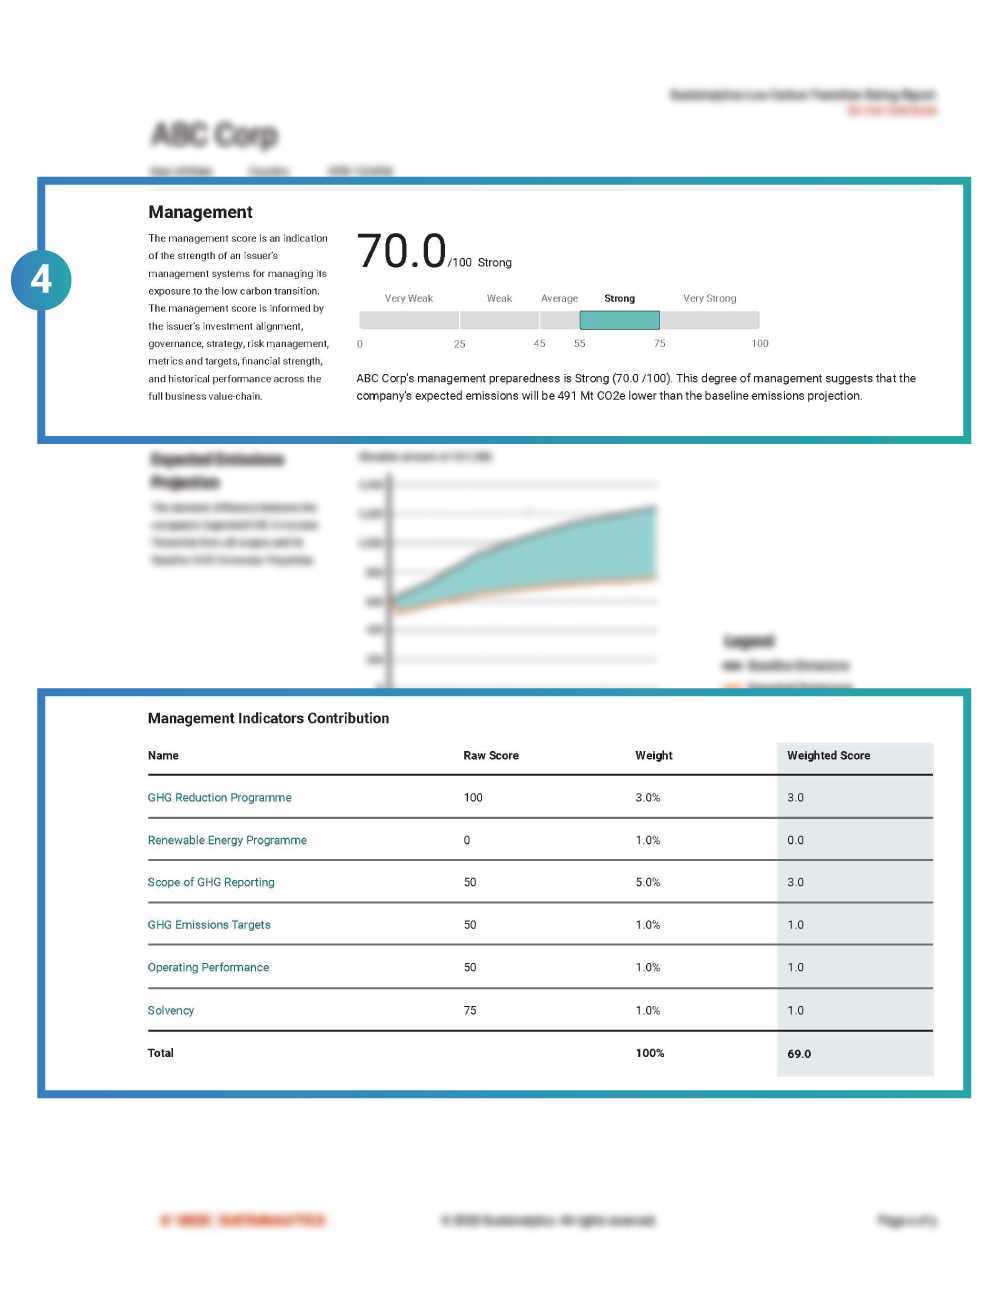
An overall management score out of 100 is provided, as well as an analysis identifying where action may be needed across the issuer's business activities. This is communicated through a breakdown of their management scores and contribution of key management indicators for each scope of emissions across the issuer’s value chain.
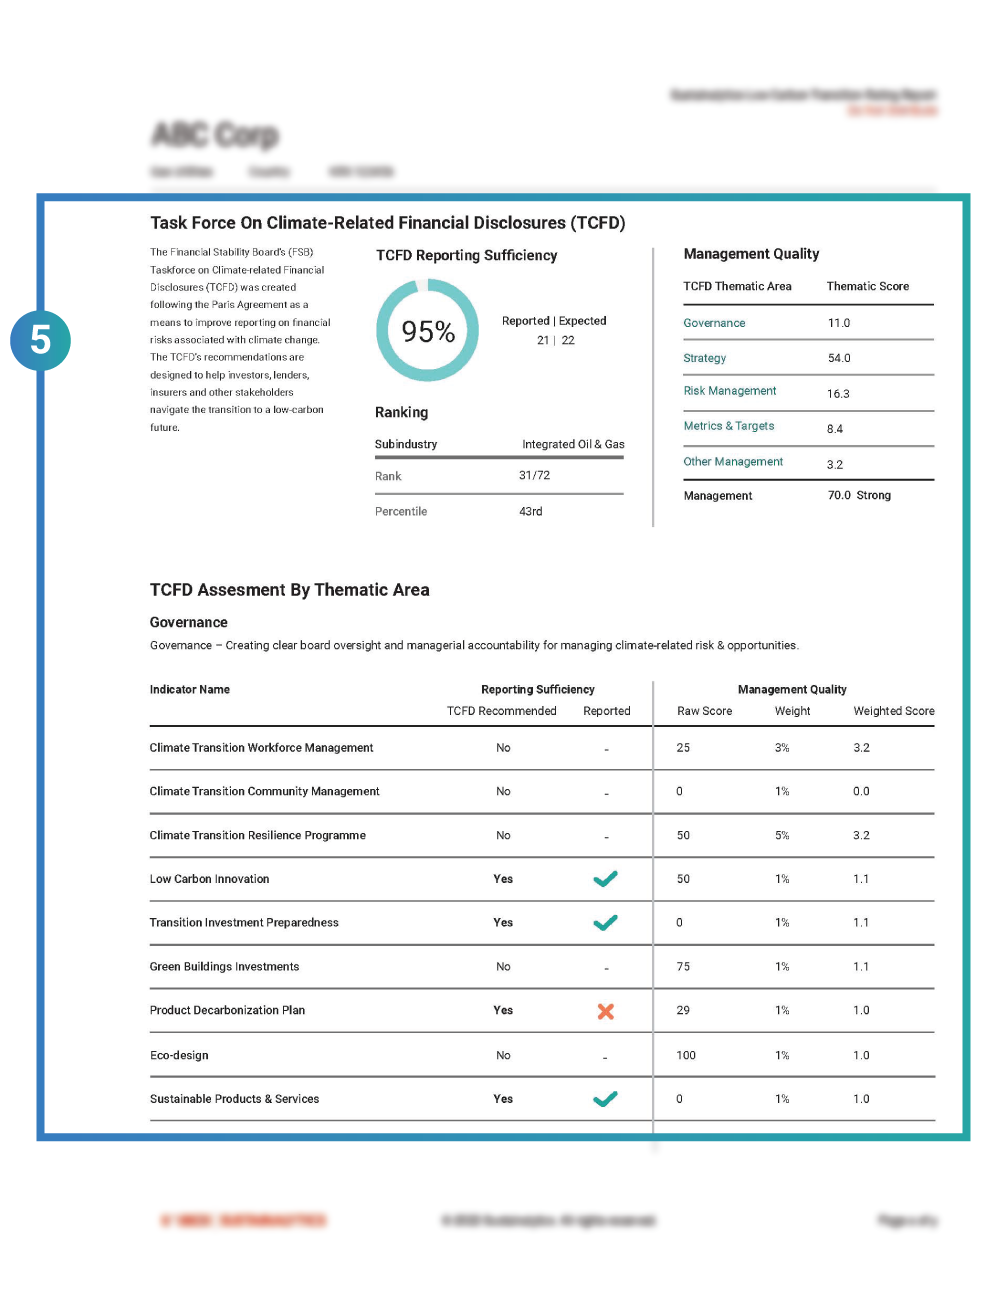
An overall score of the comprehensiveness of issuers’ climate related disclosures, and a detailed analysis across the key TCFD thematic areas of governance, strategy, risk management and metrics & targets provides transparency into quality of their management.
Why Sustainalytics?
A Single Market Standard
Consistent approach to ESG assessments across the investment spectrum.
Award-Winning Research and Data
Firm recognized as Best ESG Research and Data Provider by Environmental Finance and Investment Week.
End-to-End ESG Solutions
ESG products and services that serve the entire investment value chain.
30 Years of ESG Expertise
800+ ESG research analysts across our global offices.
A Leading SPO Provider
As recognized by Environmental Finance and the Climate Bonds Initiative.
Related Products

Climate Solutions
Identify and manage investment risks and opportunities with climate research, ratings and data for investors.
Learn More
Material Risk Engagement
Engage on the most material ESG risks identified by the ESG Risk Ratings.
Learn More
Impact Solutions
Measure, manage and report on the social and environmental impact of your portfolio.
Learn More

.tmb-thumbnl_rc.png?Culture=en&sfvrsn=12471767_1 "Raising the Bar How CSRD Emissions Reporting Rules Will Reshape Packaged Food Companies (1)")
