

Cyberthreats are broadening and deepening, and they can materially affect a company’s performance through fines, class action lawsuits, loss of consumer trust, and operational disruption.
For investors willing to limit the impact of cyberattacks on stock prices, there are helpful tools at hand to mitigate sentiment changes and assess the significance of recent news regarding long-term damage to a company.
In our recently published cybersecurity paper, The Impact of Cyberattacks on Stock Prices, we analyzed 69 immediately high-risk cyberattack news incidents. Then, we measured the average price return of stocks by conducting a time series event analysis. Exhibit 1 showcases findings one year after a major cybersecurity incident: We see sizeable losses for some stocks after a major cyberattack.
Exhibit 1: News Incidents Analysis - Annual Returns
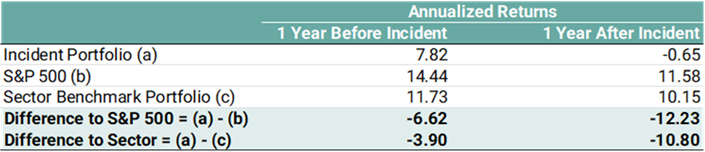
*Currency in use: Base Currency Source: Morningstar SustainalyticsWe used the Data Privacy and Security Policy (DP&S) management score as a variable to assess returns one year later, mainly due to its good historical track record depth: A fitting assessment score to measure cybersecurity strength prior to an incident.
We find a positive correlation between the management score and returns, at 33%.
Exhibit 2: Split of Data Privacy and Security Management Scores - Annual Returns1
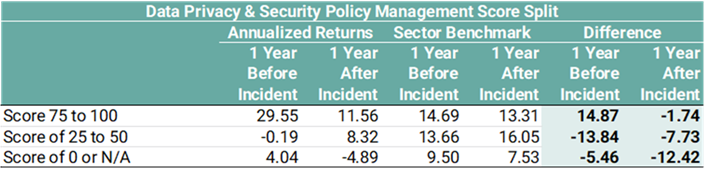
Source: Morningstar Sustainalytics
A closer look at risk reveals that companies with more robust DP&S management scores had risk benefits.
Exhibit 3 shows an ordinal ranking of better standard deviations and a diminished average maximum drawdown as the management score improves.
Exhibit 3: DP&S Policy Management Scores – One Year Risk Measures2
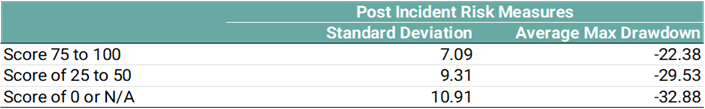
Source: Morningstar Sustainalytics
Our findings show that strong management scores within DP&S scores offer an improved probability of a lower share price downside, volatility and a decreased impact concerning future returns.
For more details on the how investors can utilize corporate DP&S management scores in their portfolio assessments, download our recent report.

Notes:
1 Management Indicator Scores include predicted, retroactively researched, and actual historical scores before the incident date.
- Data Privacy and Security Management Indicator Scores prior to incident; Score 75 to 100 (12), Score of 25 to 50 (18), Score of 0 or N/A (38).
- N/A is representative of companies where no predicted or historical research for the Management Indicator Score was available
- Currency in use: Base Currency. A financial return that does not take into consideration reinvestment of dividends. Dividends are treated as a cash payout as of the end of the period. The calculation is point to point using adjusted price at the beginning of the period and the adjusted price at the end of the period incorporating any dividends paid.
2 Management Indicator Scores include predicted, retroactively researched, and actual historical scores before the incident date.
- Data Privacy and Security Indicator Management Scores prior to incident; Score 75 to 100 (12), Score of 25 to 50 (18), Score of 0 or N/A (38).
- N/A is representative of companies where no predicted or historical research for the management score was available
- Currency in use: Base Currency. A financial return that does not take into consideration reinvestment of dividends. Dividends are treated as a cash payout as of the end of the period. The calculation is point to point using adjusted price at the beginning of the period and the adjusted price at the end of the period incorporating any dividends paid.
- Standard Deviation return calculations are made monthly. A statistical measurement of dispersion about an average and depicts how widely the returns varied over a certain period of time. Morningstar computes standard deviation using the trailing monthly total returns for the appropriate time period. All of the monthly standard deviations are then annualized.


