
Carbon emissions disclosures have improved over the last decade, however, investors interested in lowering their portfolio’s footprint are still not getting the complete picture. Although the prevalence and quality of emissions reporting for scopes 1, 2, and 3 (explained below) has improved for both private and public companies, most companies still do not disclose emissions data. As a result, investors are unable to accurately analyze and compare the carbon risks and opportunities across a complete universe of diverse company types. The need for accurate and consistent emissions estimations models is critical.
In this article we’ll highlight where corporate carbon emissions data gaps remain, explore the differences between commonly used estimation models, and share Sustainalytics’ approach to closing the gap in carbon emissions reporting.
Scope 1, 2, and 3 Emissions Reporting Remains Incomplete
Disclosures of scope 1 and 2 emissions, which refer to the direct operations of a company (scope 1) and the first-tier indirect emissions associated with purchased electricity (scope 2), are easier to measure. They continue to constitute the majority of carbon emissions reporting.
Scope 3 emissions, which refer to emissions across a company’s value chain – both upstream in development and manufacturing processes, and downstream in the use phase of a company’s goods and services – are much harder to quantify and difficult to disclose. However, based on an analysis of companies in our research universe, the quality and quantity of disclosures for scope 3 emissions is increasing at a rate more quickly than those of scope 1 and 2.
Morningstar Sustainalytics’ research revealed that for fiscal year 2021, almost 40% of companies in our global ESG universe reported scope 1 and 2 data. This is up from 33% reporting in 2020. Scope 3 disclosures for the same universe were almost 24% in 2021, up from 19% the previous year. While these figures represent an all-time high, the flip side of these figures is still alarming — 60% of scope 1 and 2 emissions data and over 75% of scope 3 emissions data are left unreported.1
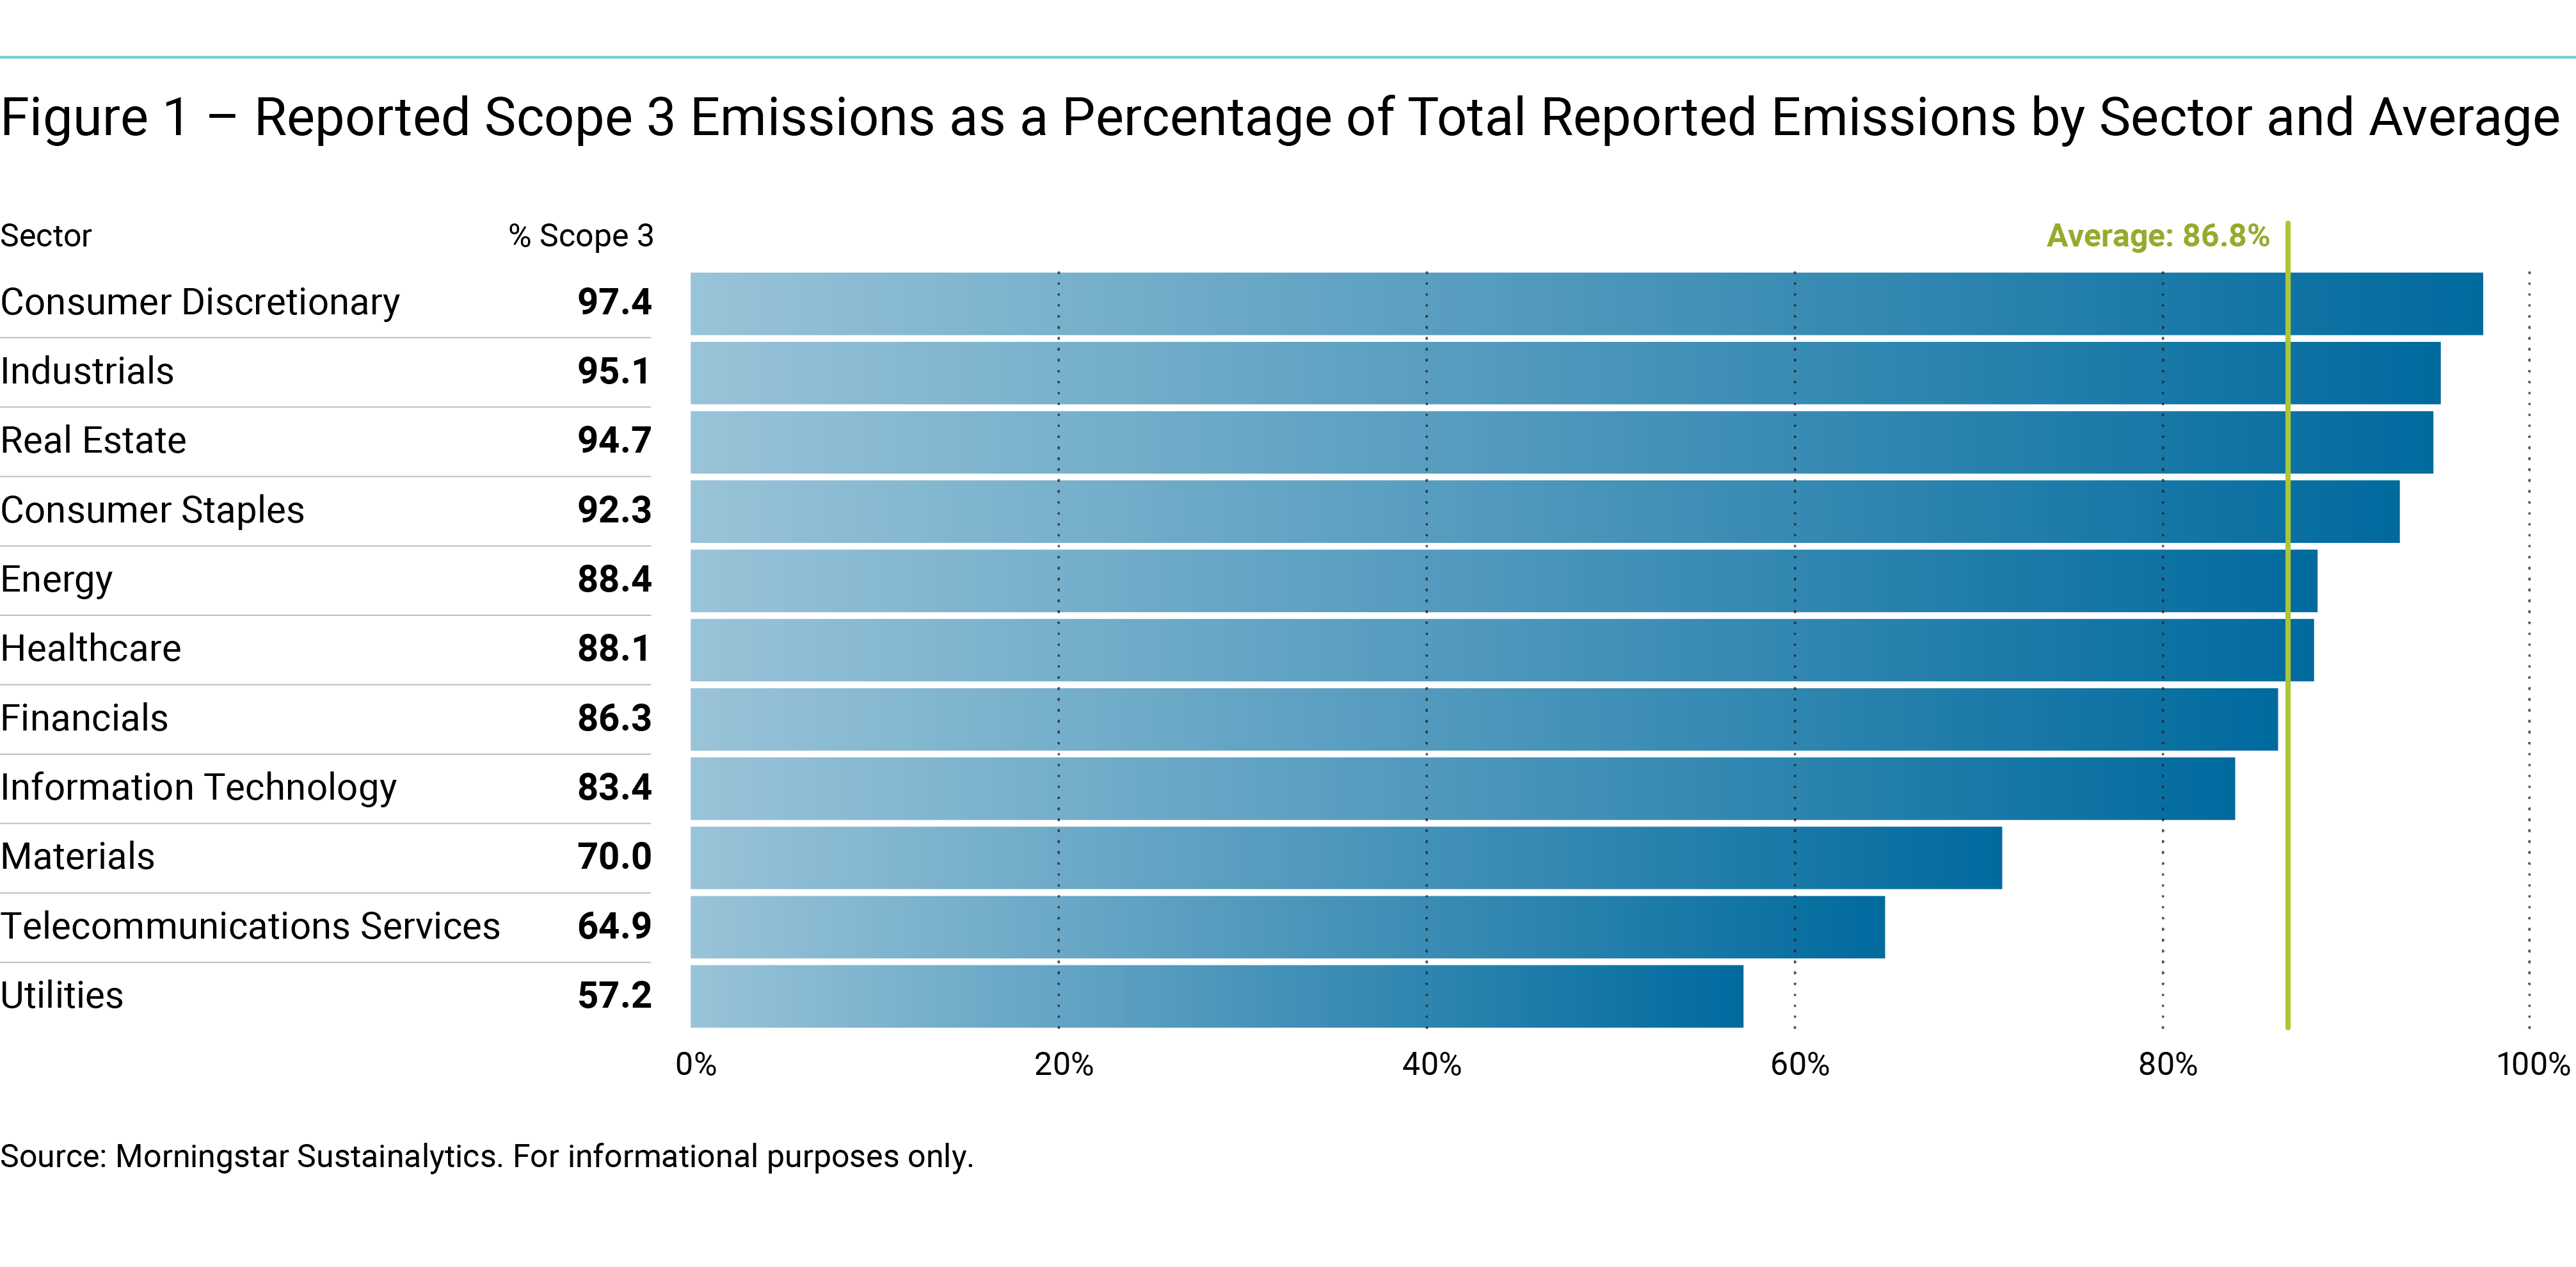
The reporting gap is even more significant in light of the fact that scope 3 emissions make up more than 60% of total emissions in every industrial sector Sustainalytics covers with the exception of the utilities sector, where that figure is 57%. In some sectors, such as consumer goods, industrials, and real estate, scope 3 represents over 90% of emissions. This under-reporting highlights a crucial need to have a rigorous and scientific estimation model for scope 3 emissions.
The Benefits of Estimating Carbon Emissions Using a Bottom-up Approach
While there are several approaches to estimating carbon emissions, for the purposes of this article we’ll be comparing two methods: a bottom-up approach, and a top-down approach.
In a bottom-up approach analysts use companies’ reported scope 1, 2 and 3 emissions data as the baseline for each subindustry average. They then apply metrics to each company as proxies for size and scale, as well as refining factors which account for geography and business model.2 This approach is the basis for Sustainalytics’ enhanced multi-metric, multi-factor (MMMF) regression model to estimate scope 1 and 2 emissions. This model complements our scope 3 estimation model, which also uses a bottom-up approach.
By using company-reported data from the current fiscal year to form a baseline, the models reflect the current economic landscape, accounting for how events such as recessions or pandemics may impact each industry and subindustry differently. By leveraging increasingly available emissions data, the dynamic nature of this model means that each year those baseline subindustry averages will be tighter and more precise, resulting in more accurate estimations once the refining factors have been included.
The primary alternative to the bottom-up approach is to employ top-down, input-output economic modelling to estimate the business models of different industries.3 Input-output modelling is a well recognized approach and has an extensive track record for understanding the complex network of how different industrial sectors interact. For carbon emissions modelling, environmentally extended input output (EEIO) models have been developed to account for the associated emissions that arise as a consequence of the economic interactions between industrial sectors to produce companies’ goods and services.
The downside of EEIO models is that they represent a point-in-time.4 Their results are only a snapshot of the current economic landscape, which itself is dynamic. If the EEIO models are not comprehensively and consistently updated, the accuracy and consistency of the carbon emissions estimation models that employ them will be diluted. As business models change – technology improves and disrupts, substitutes emerge, consumer behavior changes, etc. – EEIO models less accurately reflect the emissions associated with those business models, thus failing to perform the specific job they were designed to do.
Closing the Carbon Emissions Data Gap
Although the quality and quantity of carbon emissions reporting across all three scopes is improving, a significant gap remains in corporate greenhouse gas emissions disclosures. While several methods exist to help close that gap, a bottom-up, MMMF regression model, such as those used by our Carbon Emissions Data, offers a more robust solution to the under-reporting of carbon emissions. In an environment where less than a quarter of companies report across scopes 1, 2 and 3, it is vital that investors have accurate, stable, and future-proof emissions estimations at their fingertips.
Have questions about how your firm can tackle the scope 1, 2, and 3 disclosure gaps in your portfolio? Get in touch with our team to learn how Sustainalytics’ Carbon Emission Data solution can help or contact your client advisor.
References
1 All calculations based on analysis of Sustainalytics’ Carbon Emission Data universe. 17,407 companies for FY 2020 and 16,725 companies for FY 2021.
2 For example, a country’s electricity generation mix is used as a geographical refining factor. The carbon intensity of purchased electricity within a country is effectively the scope 2 emissions intensity of all operations in that country.
3 Raynaud, J. 2015. “Carbon Compass: Investor Guide to Carbon Footprinting.” November 23, 2015. Kepler Cheuvreux Transition Research.
4 Ibid.


