
The International Monetary Fund’s (IMF’s) recent downward revision to its projections of near-term global expansion reflects growing concerns about brewing market tensions. Central issues affecting capital markets include trade disputes between the US and China, Brexit and subdued investment and demand for consumer durables. According to the IMF’s latest outlook, global real GDP will grow 3.2% in 2019 and 3.5% in 2020 – a downgrade of 10 basis points (bps) for each year compared to the IMF’s previous outlook last April.[i]
While the slowdown in economic growth is on course to affect developing and advanced economies, the IMF’s downgrades to emerging market (EM) forecasts are especially noteworthy. Compared to its pervious 2019 projections, the IMF cut its real GDP forecasts by 10 bps for China, 30 bps for India and 130 bps for Brazil.
In our recent Spotlight report, Emerging Market Equities: Key Sources of ESG Risk, we develop a novel approach for assessing EM equities by looking at this asset class through an environmental social, and governance (ESG) lens. One of the findings of our study is that the FTSE Emerging Index has an overall weighted ESG risk score of 27.4, compared to 24.0 for the FTSE Developed Index.[ii] This gap suggests that a typical EM equity investor is exposed to about 14% more unmanaged ESG risk than a typical developed market equity investor.
As a supplement to the report, this post assesses the contributions of different sectors to the weighted ESG risk rating score of the FTSE Emerging Index and illustrates how this type of analysis can be incorporated into a sector tilting strategy that aims at mitigating ESG risk.
Sector analysis
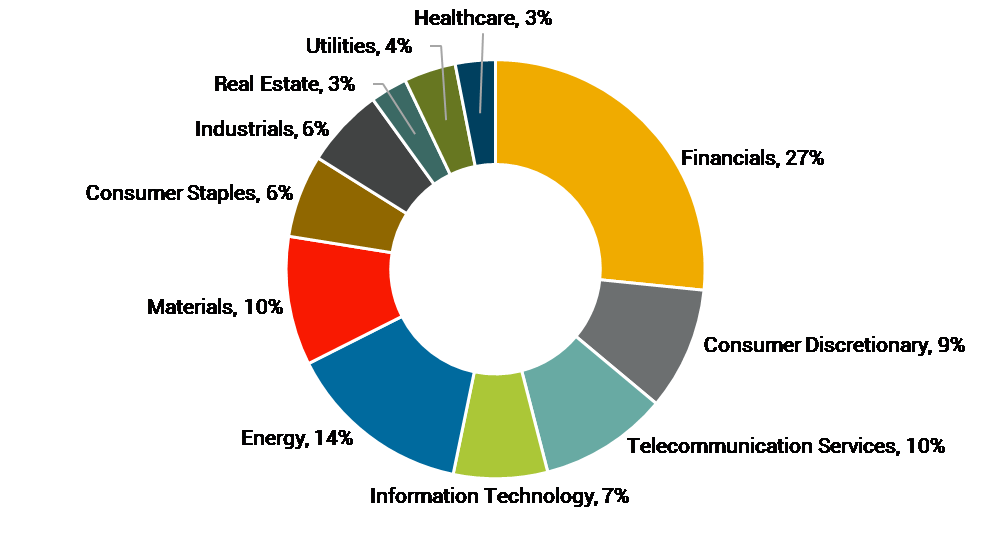
First, we account for the normalized sector weights assigned to 11 sectors covered by the EM benchmark. As shown in Figure 1, the EM index’s sector weights range from 27% for Financials to 3% for Healthcare.
Figure 1: Normalized sector weights of FTSE Emerging Index*

Next, we assess the contribution of each sector to the overall weighted ESG risk rating score of the EM index, as shown in Figure 2. Comparing Figure 1 and Figure 2 suggests that, while the contribution of some sectors to the weighted ESG risk rating score of the EM benchmark is roughly proportional to their weight in the index, several sectors face disproportionate levels of ESG risk. Energy, for example, represents only 10% of the weight of the EM benchmark, but it accounts for 14% of the index’s weighted ESG risk score.
Figure 2: Sector contributions to the weighted ESG risk rating score of the FTSE Emerging Index*
One way investors can integrate this analysis into portfolio decision making is by adjusting sector weights through a tilting strategy. This approach recognizes that different sectors face different levels of ESG risk, and that ESG risk may impact the financial performance of portfolio companies.[iii]
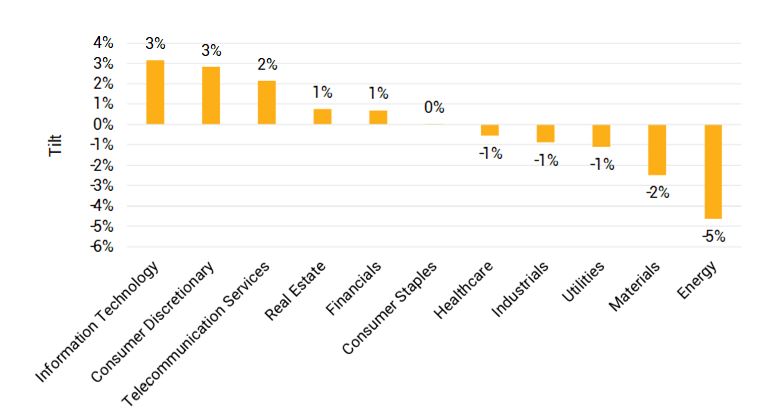
For this illustration, we calculate the tilt of each sector as the difference between its normalized weight in the EM index and its relative contribution to the EM index’s weighted ESG risk rating score. While positive tilts allocate more weight to sectors that contribute proportionally less ESG risk to the EM index, negative tilts allocate less weight to sectors that contribute proportionally more ESG risk.[iv]
As shown in Figure 3, this analysis suggests that a typical EM equity investor can mitigate portfolio ESG risk with tilts ranging from -5% to +3%. Five sectors – Information Technology, Consumer Discretionary, Telecommunication Services, Real Estate and Financials – face proportionally less ESG risk and are, therefore, assigned positive tilts. A single sector – Consumer Staples – contributes a level of ESG risk that is proportional to its allocation in the index. The five other sectors – Healthcare, Industrials, Utilities, Materials and Energy – account for an outsized portion of ESG risk, so they receive negative tilts.
Figure 3: ESG risk-driven sector tilts
Further research
Beyond sector-focused analysis, EM equity investors can incorporate other ESG and financial criteria into their portfolio strategies. In our report, we reveal material ESG issues that comprise sources of risk for EM investors and that could be addressed with targeted corporate engagements. We also analyse the relationship between ESG risk and the IMF’s most recent GDP growth forecasts. For more information, download a copy of our ESG Spotlight Series report, Emerging Market Equities: Key Sources of ESG Risk.
Notes:
[i] The International Monetary Fund (23.07.2019), World Economic Outlook, Update accessed (23.07.2019) at: https://www.imf.org/~/media/Files/Publications/WEO/2019/Update/July/English/WEOupdateENGJuly2019.ashx?la=en.
[ii] Sustainalytics’ comprehensive ESG Risk Ratings cover 80% of the marketcap weight of the EM benchmark and 90% of the DM benchmark. We normalize the weights of the matched security results within the benchmark to equal 100% of the total index weight by evenly redistributing unmatched security weights. Weighted scores are calculated by aggregating normalized security weighted scores.
[iii] Supporting this thesis, a meta-study of empirical research suggests that ESG factors have a pronounced positive effect in EMs. Looking at 402 studies, 65% of those focused-on EMs found a positive contribution of ESG factors to corporate financial performance, compared to a 38% of DM focused studies. See, Friede, G., Busch, T. and Bassen, A. (2015), “ESG and financial performance: aggregated evidence from more than 2000 empirical studies,” Journal of Sustainable Finance & Investment, accessed (29.07.2019) at: https://www.tandfonline.com/doi/full/10.1080/20430795.2015.1118917.
[iv] For an approach to tilting based on ESG incidents, see: Morrow, D., Vezér, M., Apostol, A. and Vosburg, K. (2017), Understanding ESG incidents: key lessons for investors, Sustainalytics Thematic Report, last accessed (29.07.2019) at: https://www.sustainalytics.com/knowledge-center/.


