
The demand for raw materials is set to nearly double by 20501 due to population growth, rising living standards, and the low-carbon transition that will see the widespread and increasing use of low-carbon technology. Electrification, energy storage technologies and low-carbon power generation rely on critical raw materials, including lithium, cobalt, nickel, and rare earth elements. This article covers three key considerations for investors to understand how and why industry use and reliance on these raw materials can pose elevated risks.
Reserve Life Serves as the Upper Limit of Raw Materials Availability
As the world prepares for the first global stock take2 to evaluate progress made towards meeting Paris Agreement-aligned climate targets, the development and adoption of clean energy technologies remains central to decarbonization efforts. As a result, certain industries face the elevated risk of experiencing raw material shortfalls by 2030. The physical scarcity of raw materials, or reserve life, is assessed via reserve-to-production (R/P) ratios that indicate relative abundance or scarcity. It provides insight on whether current reserves are sufficient to support consumption over a multidecade time frame.
With lead times — from the discovery of mineral resources to production — averaging 17 years globally,3 production growth is unlikely to proceed in lockstep with demand. Structural capital underspending on mining projects4 further exacerbates the dearth of required material inputs.
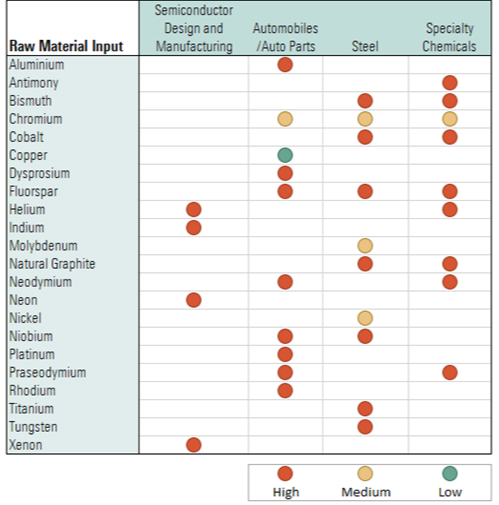
As shown in Table 1 below, the steel industry uses a range of raw material inputs that are deemed physically scarce. These raw materials are used as agents to produce high-performance steel alloys or to alter metallurgical properties. As the automotive industry continues the shift to electric vehicles (EV), it has reduced its consumption of certain scarce raw materials, for example by using niobium in place of cobalt in new battery cathodes and anodes.5 These niobium-based EV batteries are now paving the way for ultra-fast charging due to their higher performance and improved electronic conductivity. However, while certain raw materials remain geologically abundant, geopolitical tensions may still curb access.
Table 1. Raw Materials Physical Scarcity Risks Per Select Industries6 7

Based on data from the International Energy Agency (IEA), United States Geological Survey and Sustainalytics research. Data as of May 2023. For informational purposes only. Risk of physical scarcity is expressed by the categories High, Medium or Low.
Supply Concentration Poses Production Risks
The unequal spread of raw material across countries can generate accessibility issues. Although global market trade in commodities can overcome availability issues for raw materials that cannot be sourced locally, it also introduces a slew of factors that heighten environmental, social and corporate governance (ESG) risks. The more concentrated the supply of raw materials, the greater the impact and risk of temporary or permanent curtailment of raw materials production from a single supplier country.
As shown in Table 2, neon is categorized as high risk in the semiconductor design and manufacturing industry. Nearly three-quarters of the neon produced globally is earmarked for the semiconductor industry, as high-purity neon is an important process gas in the manufacture of computer chips. The pursuit of economies of scale led to the construction of expansive air separation plants associated with steel manufacturing in a few geographic locations that ensured both abundant feedstock and substantial scale. Roughly half of semiconductor-grade neon comes from two Ukrainian companies, Ingas and Cryoin, and both shuttered their operations following Russia’s invasion, forcing several semiconductor companies to scale back production.8
Table 2. Raw Material Supply Concentration Risk Per Select Industries9
Based on data from United States Geological Survey (USGS), Sustainalytics Institutional Capital Scores, and other Sustainalytics research. Data as of May 2023. For informational purposes only. Supply concentration risk is expressed by the categories High, Medium or Low.
Another raw materials group that has high supply concentration is rare earth elements (REE), such as praseodymium and neodymium, of which approximately 80% is supplied by China.10 REEs are used as catalysts and polishing powders in the specialty chemicals industry. Despite REE’s relative geological abundance (reserve-to-production categorized as low risk), the over-reliance on a single country for REEs implies a high-risk scenario in the instance that supply is disrupted.
Demand Intensity Could Exacerbate Resource Strain
The dynamics in the supply of raw materials can greatly impact operating margins and sales, posing challenges for companies. This situation puts their earnings and enterprise value at risk, especially if they are unable to pass on costs to end users. The stronger the cumulative demand is for a set of raw material inputs, the higher the likelihood of supply bottlenecks at the industry level.
For instance, despite indium being in the high risk category for reserve-to-production and supply concentration (see Tables 1 and 2 above), Table 3 shows that the likelihood of supply shortages of indium materially impacting the semiconductor design and manufacturing industry are deemed low. Although indium has many semiconductor-related applications, the industry’s comparatively low share of global indium consumption mitigates the risks posed by higher demand.
Table 3. Raw Material Demand Intensity Per Select Industries11
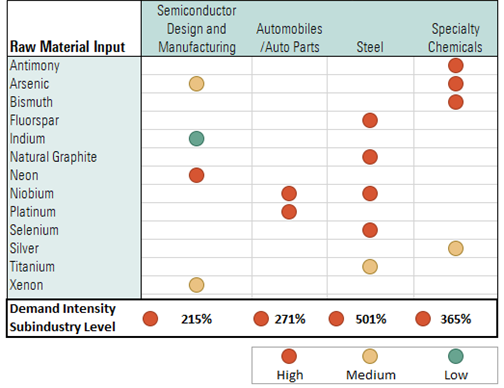
Based on data from United States Geological Survey (USGS), Eurostat, and Sustainalytics research. Data as of May 2023. For informational purposes only. Risk associated with demand intensity for each individual raw material and at industry level are expressed by the categories High, Medium or Low.
Physical scarcity is not the only risk posed by nonrenewable raw materials. The potential for the outbreak of geopolitical tensions — and their ability to have a negative impact on international relations and trade — provide another dimension of risk where supply is concentrated among just a few nations. This is exacerbated by subpar sovereign governance practices of several commodity-producing nations. Demand intensity can either amplify or attenuate the impact of raw material supply disruptions.
A more reliable supply of critical raw materials is needed to curb the risk of supply falling short of demand and associated production disruptions. In addition, it supports companies across industries to remain on-track to meeting net zero by 2050 pledges. Future-proofing supply chains must involve measures to diversify and/or localize the supply of raw materials or finding effective substitutes that are less prone to risk derived from availability or accessibility.
References
- Organisation for Economic Co-operation and Development. 2019. “Global Material Resources Outlook to 2060.” February 2019. https://read.oecd-ilibrary.org/environment/global-material-resources-outlook-to-2060_9789264307452-en#page1.
- The global stocktake was established under Article 14 of the Paris Agreement. It refers to a process for countries and stakeholders to assess collective progress made towards meeting the goals of the Paris Climate Change Agreement and identify potential gaps. The first stock take is set to occur at the end of 2023.
- Statista. 2022. “Average Lead Times for Mineral Resources Worldwide From Discovery to Production Between 2010 and 2019.“ March 2022. https://www.statista.com/statistics/1297832/global-average-lead-times-for-mineral-resources-from-discovery-to-production/.
- GlobalData. 2022. “Inadequate Spending on Mining Hampers Transition to Green Energy.” June 2022. https://www.globaldata.com/data-insights/mining/inadequate-spending-on-mining-hampers-transition-to-green-energy/.
- Niobium Technology. 2023. Company website. https://niobium.tech/en/niobium-based-battery.
- The selected industries in Tables 1,2 and 3 are designated subindustries in accordance with Sustainalytics’ own industry classification system. It categorizes companies into peer groups (subindustries). This classification is based on an assessment of business operations, products and services, and takes into account common environmental, social and governance challenges.
- Expected production through 2050 has been adjusted for expected population growth, rising living standards, and the increasing number of applications of critical raw materials in low-carbon technologies.
- Alper. A. 2022. “Exclusive: Russia’s Attack on Ukraine Halts Half of World’s Neon Output for Chips.” Reuters. March 11, 2022. https://www.reuters.com/technology/exclusive-ukraine-halts-half-worlds-neon-output-chips-clouding-outlook-2022-03-11/.
- Supply concentration risk is modeled via an adjusted Herfindahl-Hirschman Index, or HHI, score to measure the degree of supply concentration among resource producing countries. Sustainalytics' Institutional Capital Scores has been used as a proxy for geopolitical and/or governance risks. A significant proportion of raw materials are associated with conflict-affected or high-risk areas. Therefore, the more concentrated the supply of raw materials from these high-risk areas, the greater the impact and risk of temporary or permanent curtailment of production from a single supplier (country).
- Barrett, E. (2022) “China has a stranglehold on the world’s supply of critical rare earths. These firms are trying to loosen its grip.” Fortune. July 22, 2022. https://fortune.com/2022/07/22/china-rare-earths-monopoly-lynas-pensana-iluka-us-supply/.
- Demand intensity is first calculated at the level of the raw material based on what share that industry commands of the total demand for a particular raw material. The higher the demand intensity, the greater the impact and risk of supply bottlenecks. Demand intensity at the industry level is the sum of demand intensity of individual raw material inputs used in production by that subindustry. If an industry commands a significant proportion of cumulative demand for a range of raw materials, then risk and impact of shortages rise in tandem.


