

Investors play a crucial role in driving the transition to a low carbon economy. So, when assessing companies’ management of climate-related transition risks, investors will need to evaluate all material greenhouse gas (GHG) emissions across their portfolio companies’ value chains.
However, despite the growing list of climate reporting frameworks and mandates requiring detailed emissions information across all scopes, transparency regarding value chain emissions, or scope 3 emissions, lags that of scope 1 and scope 2 emissions. Our research revealed that for fiscal year 2021, almost 40% of companies in our global research universe reported scope 1 and scope 2 data, but only 24% of companies reported scope 3 emissions. This significant information gap likely means that there are many climate-related risks that companies and investors are overlooking.
In this blog post we’ll answer the key questions investors need to know about value chain GHG emissions, focusing on supply chain GHG emissions, and why decarbonization of the supply chain is an essential component of an effective climate transition strategy.
Question One: What are value chain emissions?
Value chain GHG emissions, also known as scope 3 emissions, are indirect emissions associated with a company’s supply chain, sold product use, or investments. There are fifteen categories of scope 3 emissions that are split into upstream and downstream activities (see Table 1).
Table 1. Scope 3 Categories by Value Chain Split1
Upstream | Downstream |
| 1. Purchased Goods and Services | 9. Downstream Transportation and Distribution |
| 2. Emissions from Capital Goods | 10. Processing of Sold Products |
| 3. Fuel and Energy-related Activities | 11. Use of Sold Products |
| 4. Upstream Transportation and Distribution | 12. End of Life Treatment of Sold Products |
| 5. Waste Generated in Operations | 13. Downstream Leased Assets |
| 6. Business Travel | 14. Franchises |
| 7. Employee Commuting | 15. Investments (Includes Financed Emissions) |
| 8. Upstream Leased Assets |
Source: GHG Protocol, Morningstar Sustainalytics. For informational purposes only.
Upstream emissions are indirect GHG emissions related to purchased or acquired goods and services, and which occur up to the point of receipt by the reporting company. Examples include the GHG emissions generated due to the demand and purchase of raw materials, such as crops, chemical components, and metals.
Downstream emissions, on the other hand, are indirect GHG emissions that result from the use or disposal of a company’s goods or services. These emissions usually occur after the goods or services are sold by the reporting company and control is transferred from the reporting company to another entity (e.g., a customer). Examples of activities that result in downstream GHG emissions include the use of vehicles, electronics, and investments.
Depending on the company’s characteristics, such as its industry membership, countries in which it operates, or length of its supply chain, some categories of scope 3 emissions may be more material than others, meaning changes in those emissions – either positive or negative – could significantly affect its business.
Question Two: What challenges do companies and investors face in measuring and reducing supply chain emissions?
The transition to a low carbon economy entails significant challenges in controlling and reducing supply chain emissions. Upstream emissions, associated with the supply chain, are difficult for companies to track and manage, due to the complexity of global supply chains, and the numerous companies involved within and across the different tiers. Supply chain emissions are also difficult to quantify, especially as they occur beyond tier 1 and 2 suppliers where companies have little control over the practices suppliers have in place. To achieve decarbonization across global value chains, companies will need to engage with their suppliers to support the monitoring, measurement and target setting necessary to meet net zero targets and limit global warming to 1.5 degrees Celsius by 2050.
Question Three: How much do scope 3 supply chain emissions contribute to a company’s overall emissions footprint?
On average, scope 3 emissions comprise 60% of a company’s total GHG emissions footprint.2 This means that emission reduction strategies for both scope 3 upstream and downstream emissions have the potential to have the highest absolute impact on the transition to a low carbon economy.
Scope 3 emissions are increasingly recognized as an important aspect of corporate sustainability and climate action, and represent the area where companies are likely to face the highest transition-related climate risks.
Assessing and disclosing scope 3 upstream emissions can help investors identify and manage the potential climate-related risks associated with a company's operations, supply chain, and products. Investors can also gain a more comprehensive view of the company's GHG footprint and its exposure to climate-related risks.
Question Four: Which industries are most impacted by scope 3 upstream/supply chain emissions?
Companies in sectors with especially long and complex supply chains, such as manufacturing, food-related sectors, and packaged goods, are particularly exposed to scope 3 upstream emissions.
Looking more closely at the overall food sector, supply chain emissions are set to overtake farming and land use as the largest contributor of GHGs from the agri-food system.3 Figure 1 below shows select food sector subindustries and the percentage each scope contributes to their overall GHG emissions. Across these subindustries, scope 3 upstream emissions contribute the highest percentage of GHG emissions, from 60% to upwards of 90% of subindustries’ total emissions.
Figure 1. Weight Percentage of Scope 1, 2, and 3 (Upstream and Downstream) Emissions For Select Food Subindustries
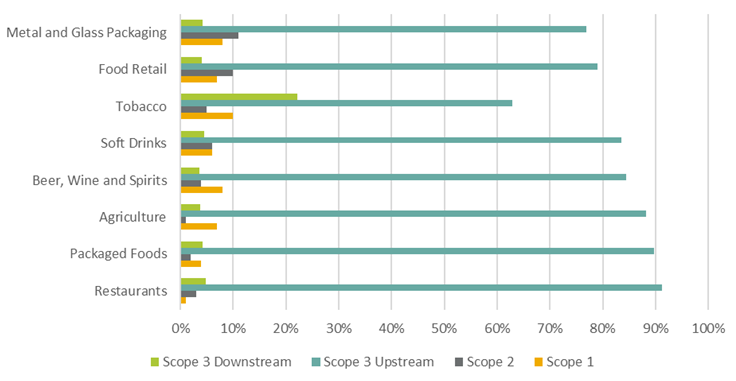
Source: Morningstar Sustainalytics. For informational purposes only.
For companies in these subindustries, supply chain GHG emissions can significantly affect their exposure to risks associated with the transition to a low carbon economy. For example, when looking at the top five food producers in our Low Carbon Transition Ratings universe (see Figure 2), their average implied temperature rating4 is below 2 degrees when only considering scope 1 and 2 emissions. This signifies a combination of low exposure to carbon risks and/or strong management of those risks. However, the same companies have an average implied temperature rating of 4.2 degrees when scope 3 upstream emissions are included (i.e., all scopes), implying higher exposure and potentially weaker management of carbon risks.
Figure 2. Comparison of Top Five Food Producers' LCTR Ratings According to Scope 1 and 2 Versus All Scopes
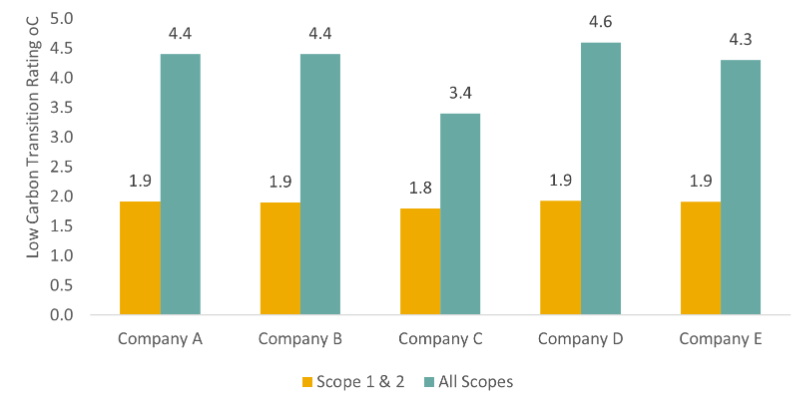
Source: Morningstar Sustainalytics. For informational purposes only.
Question Five: What should investors consider when assessing portfolio companies' management of scope 3 emissions?
Whether an investor focuses on managing climate risks or creating positive impact through active engagement of companies, understanding the full impact of a company’s value chain should be a priority. To do that, investors should consider the following:
The quality of scope 3 disclosures: Analyzing the quality of scope 3 disclosures and understanding which scope 3 categories are material for a specific company can help investors make informed investment decisions. Companies’ public commitments should also include these material categories. The disclosure of scope 3 emissions is crucial to identifying and managing the potential climate-related risks associated with a company's operations, supply chain, and products, and investors can gain a more comprehensive view of the company's carbon footprint and its exposure to climate-related risks.
As companies’ net-zero target claims are coming under increased scrutiny,5 failure to include material scope 3 emissions in such targets could reduce their credibility. In other words, GHG emissions disclosure and reduction targets that do not include material scope 3 categories could result in climate-related risks being overlooked.
A company’s climate governance structure: In terms of companies’ management practices and governance structures, including material scope 3 categories in sustainability transition management strategies will reinforce the credibility of those strategies, whereas excluding them might be viewed as a weakness.
Climate policies across jurisdictions: An increasing number of climate disclosure policies across jurisdictions are moving from voluntary disclosures of scope 3 emissions to mandatory reporting. Mandating the disclosure of emissions across the supply chain will provide more transparency of climate risks and create greater accountability for the impacts and the management of climate-related risks. For example, the European Union’s Corporate Sustainability Reporting Directive (CSRD) will make reporting of material scope 3 emissions mandatory. The EU's proposed Corporate Sustainability Due Diligence (CSDD) Directive was developed to strengthen and to structure the value chain assessments and disclosures required by CSRD. If enacted, the CSDD would require companies to implement due diligence regarding human rights and environmental impacts along their supply chain, meaning that they can no longer ignore the impact they have across their value chain.
Several countries have also introduced mandatory climate-related corporate disclosures. Many of these requirements are aligned with the guidelines of the Task force on Climate-related Financial Disclosure.
Still have questions about how scope 3 emissions are affecting your portfolio transition strategies? Contact our team to discuss how Morningstar Sustainalytics can help you assess your climate transition risks or download Managing Risks for a Changing Climate: A Guide for Institutional Investors.
References
1 Adapted from Greenhouse Gas Protocol by Morningstar Sustainalytics.
2 Morningstar Sustainalytics GHG Emissions Data, March 2023.
3 Food and Agriculture Organization. 2022. “Pre- and post-production processes increasingly dominate greenhouse gas emissions from agri-food systems.” April 14, 2022. Earth System Science Data. https://essd.copernicus.org/articles/14/1795/2022/essd-14-1795-2022.pdf.
4 The Implied Temperature Rating (ITR) is the final output of our Low Carbon Transition Rating which assesses company’s exposure to and management of climate transition risks. The ITR is the temperature by which the Earth would warm if the global economy were on a similar pathway as the company being rated and is expressed in degrees Celsius.
5 Chan, K. 2022. “UN Experts Urge Stringent Rules to Stop Net Zero Greenwash.” Associated Press. November 8, 2022. https://apnews.com/article/business-united-nations-antonio-guterres-climate-and-environment-a18dd42c40e89fc58f66f906a738ef8b.


