This article includes contributions from:
- Olivier Givaudan, Senior Manager, ESG Methodology
- Bahar Yay Celik, Associate Director, ESG Methodology
- Mihai Cojocaru, Lead Analyst, ESG Methodology
- Anique Ahmed, Senior Analyst, ESG Methodology
- Alexandru Minzatu, Senior Analyst, Research and Methodology Oversight
- Alexandra Dodita, Associate Director, Research and Methodology Oversight
Key Insights:
|
|
|
|
Double materiality is a foundational principle of the EU’s Corporate Sustainability Reporting Directive (CSRD). It is designed to improve the transparency, consistency, and comparability of sustainability disclosures. Under the CSRD, companies of a certain size must assess and disclose sustainability topics using a double materiality perspective in line with the European Sustainability Reporting Standards (ESRS). Recent regulatory updates1 aim to simplify the process by streamlining disclosure requirements, but reporting from a double materiality perspective remains complex and challenging.
Mapping Double Materiality Across Subindustries
To help investors navigate these requirements, Morningstar Sustainalytics developed the CSRD Double Materiality Assessment (DMA) tool. The tool consolidates detailed materiality evaluations across subindustries and ESRS topics, providing a structured view of sustainability relevance from both an impact and a financial perspective. The CSRD DMA tool evaluates all 135 Sustainalytics subindustries across the 10 ESRS topics.
Table 1. ESRS Topical Standards
| Topics |
|---|
| E1 Climate Change |
| E2 Pollution |
| E3 Water and Marine Resources |
| E4 Biodiversity and Ecosystems |
| E5 Resource Use and Circular Economy |
| S1 Own Workforce |
| S2 Workers in the Value Chain |
| S3 Affected Communities |
| S4 Consumers and End Users |
| G1 Business Conduct |
Source: European Commission.
In a series of reports, we examined these intersections and highlighted how pervasive sustainability considerations are across the global economy. Part one provides an overview of double materiality, which combines two distinct dimensions. Part two discusses impact materiality and how a company’s activities affect each ESRS topic. Part three covers the other dimension, financial materiality, and assesses whether the omission or misstatement of an ESRS topic could reasonably influence financial decisions by affecting a company’s economic value, financial performance, cash flows, or cost of capital. Together, these perspectives underpin the CSRD’s approach to sustainability reporting.
Overall, 87% of subindustry-topic combinations are deemed material from a double materiality perspective, underscoring the relevance of ESG factors across subindustries rather than a narrow concentration in a few high‑risk subindustries. Of these 87%, 42% are material from both financial and impact perspectives, while 45% are material from only one dimension. Only 13% of all combinations are assessed as non‑material.
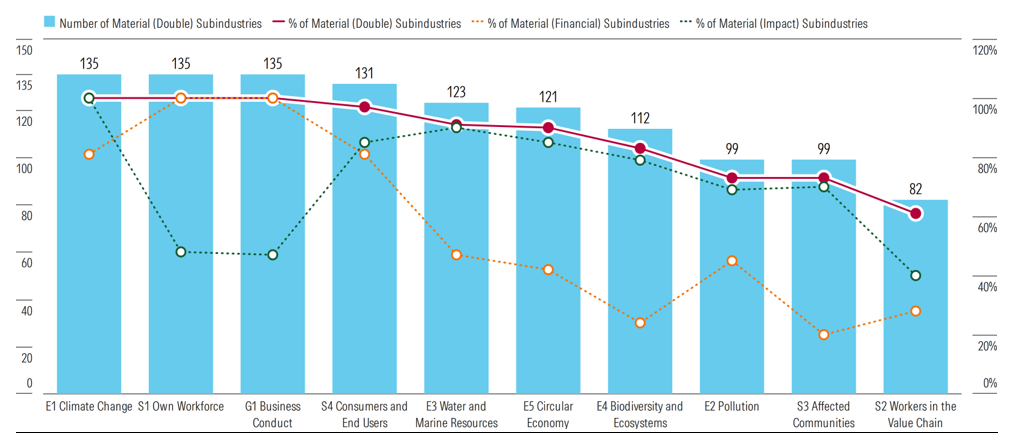
At the topic level, E1 Climate Change, S1 Own Workforce, and G1 Business Conduct are material across all 135 subindustries (as seen in Figure 1), highlighting their universal importance for sustainability reporting and ESG risk management. The topic S4 Consumers and End Users is material for 97% of subindustries, while S2 Workers in the Value Chain is the least material topic, though still material in 61% of subindustries.
Figure 1. The 10 ESRS Topics in Order of Materiality for Subindustries
Source: Morningstar Sustainalytics. Data as of January 2026.
Materiality drivers vary across topics. Financial materiality dominates for S1 Own Workforce and G1 Business Conduct, while impact materiality plays a larger role for environmental topics, such as E2 Pollution, E3 Water and Marine Resources, E4 Biodiversity and Ecosystems and E5 Circular Economy, and one social topic, S3 Affected Communities. On the other hand, we see a much more balanced contribution between both dimensions for E1 Climate Change, S4 Consumers and End Users, and S2 Workers in the Value Chain. This reinforces the idea that financial materiality and impact materiality do not always align with each other neatly and should be evaluated at a granular, topic‑specific level.
How Many Topics Are Material?
For most subindustries, the CSRD DMA tool identifies a relatively broad set of material ESRS topics. Most subindustries have between eight and 10 material topics from a double materiality perspective, while about one-third have all 10 ESRS topics deemed material.
It is important to note, though, that a smaller number of material topics does not imply lower overall ESG risk or impact (i.e., a lower intensity). Instead, it reflects a narrower scope of material sustainability issues relevant to that subindustry.
Our analysis also examines whether and how financial materiality and impact materiality are interconnected using statistical tests across topics and subindustries. Overall, we find no strong or consistent relationship between the two dimensions, only moderate, topic‑specific relationships for E2 Pollution and E3 Water and Marine Resources, and even these are relatively weak. Where relationships exist, they are generally positive but limited, reinforcing the need for topic‑by‑topic assessment rather than broad assumptions about alignment.
Impact Materiality: Broad and Interconnected Effects
Viewed specifically through an impact lens, our analysis shows that corporate impacts are typically wide‑ranging and interconnected. Nearly two‑thirds of all subindustries (63.7%) exhibit material impacts across seven or more ESRS topics, while 18.5% have material impacts across all 10 topics. This reflects the scope of the ESRS framework, the interconnected nature of ESG impacts, and the influence of cross‑cutting issues such as climate change.
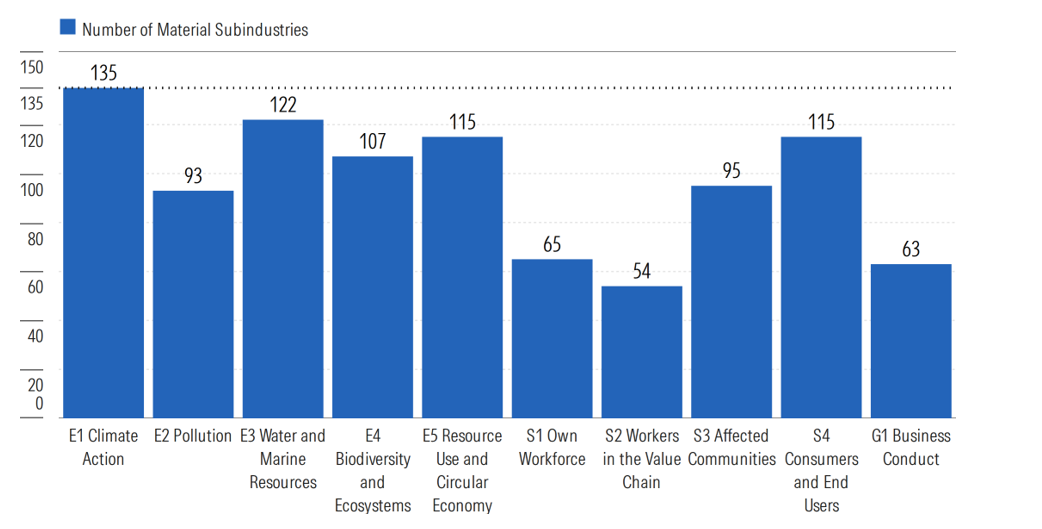
Figure 2. Number of Material Subindustries by ESRS Topics
Source: Morningstar Sustainalytics. Data as of December 2025.
Among the ESRS topics, E1 Climate Change, E3 Water and Marine Resources, E5 Resource Use and Circular Economy, and S4 Consumers and End Users emerge as the most impactful. Climate change is material for all subindustries, with renewable power generation standing out as the only subindustry with a predominantly positive climate impact due to its role in reducing reliance on fossil fuels through clean energy production.
Water‑related impacts (E3) are material for roughly 90% of subindustries, reflecting the widespread dependence on water in business operations. With increasing water scarcity concerns worldwide, excessive water dependency can exacerbate issues due to already strained water resources. In addition, increased water withdrawal can considerably affect marine life.2,3 Topics E5 Resource Use and Circular Economy and S4 Consumers and End Users are each material for 115 out of 135 subindustries, highlighting the importance of resource efficiency and the effects that products and services have on consumer well‑being.
At the other end of the spectrum, S2 Workers in the Value Chain and G1 Business Conduct have the fewest subindustries with material impacts (even if they show financial materiality), partly due to challenges in impact attribution and limitations in transparency. S2 is material for 40% of subindustries, while G1 is material for 46.7%.
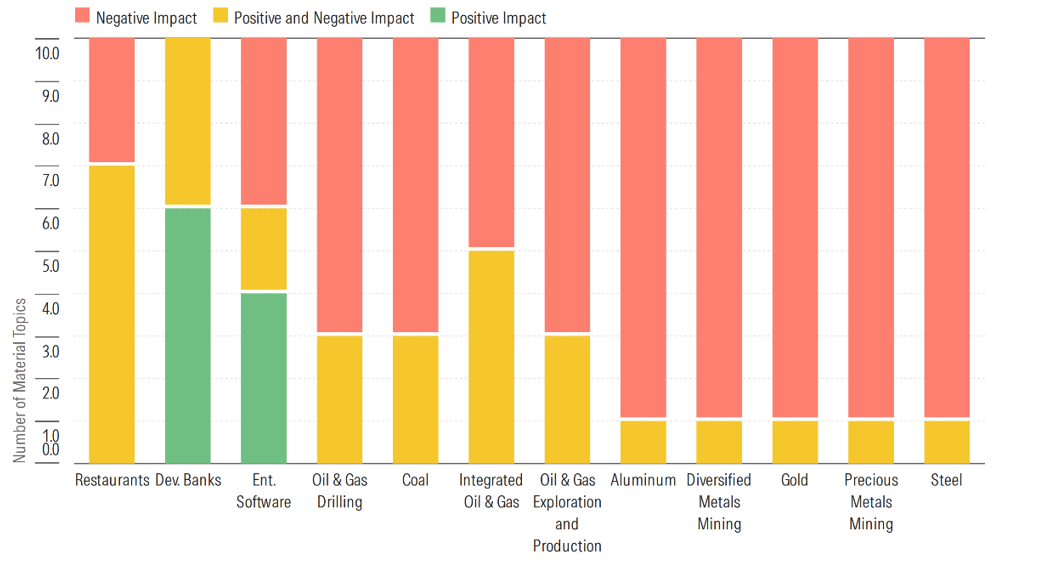
Subindustry‑level analysis further shows that extractive and resource‑intensive sectors, including diversified metals mining, gold, and oil and gas drilling, exert material impacts across all ESRS topics, as Figure 3 shows. These impacts are largely skewed toward negative environmental and social externalities. Notably, some service‑oriented subindustries, including restaurants, development banks, and entertainment software, also fall into the group with the highest impact. Unlike extractive sectors, these subindustries tend to exhibit mixed impact profiles, with both negative and positive effects.
Figure 3. Nature of Impact for Listed Subindustries
Source: Morningstar Sustainalytics. Data as of January 2026.
For example, restaurants can have many material effects that fall under multiple ESRS topics, including E1, E2, E3, and E5. Their energy‑intensive operations4 (primarily due to kitchens, heating, ventilation, and air conditioning requirements) can result in substantial water consumption, and extensive use of single‑use and difficult-to-recycle packaging, which can hinder circularity.
Looking at S1, S3, and S4 more closely, on the positive side, restaurants often provide diverse entry-level opportunities, including for marginalized groups and those facing barriers to employment. However, these roles frequently involve job quality challenges characterized by low pay, limited benefits, and irregular working hours.
Financial Materiality and Reporting Readiness
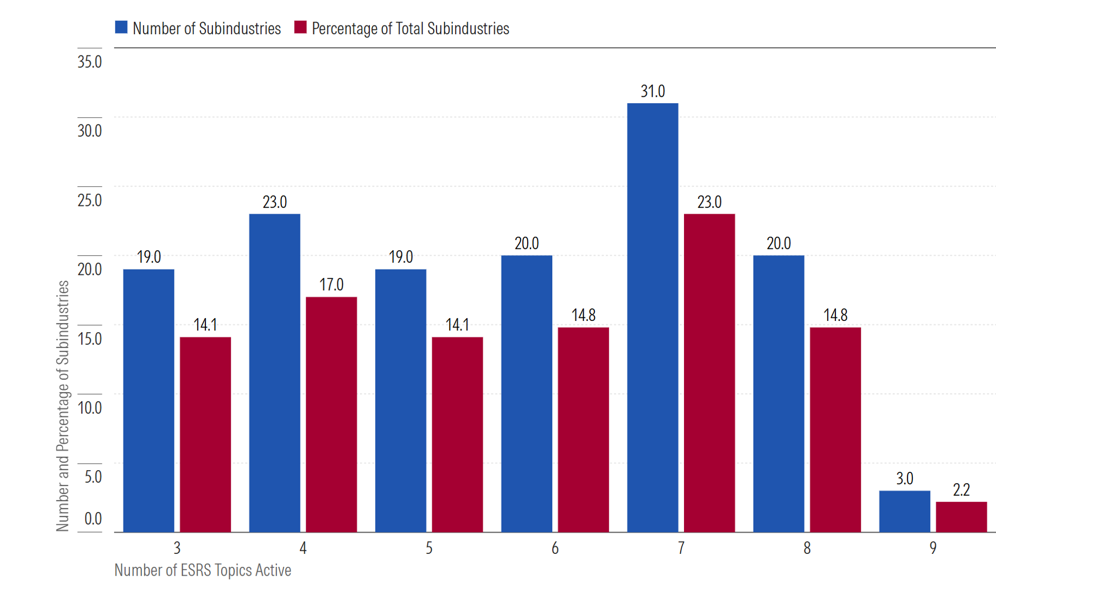
From a financial perspective, the analysis identifies 56.9% (768) of all subindustry-topic combinations as financially material, while 43.1% (582) are not. As seen in Figure 4, most subindustries face financial materiality across three to eight ESRS topics, with a concentration at seven topics. This distribution aligns with the ESRS principle of proportionality, which aims to balance completeness with relevance.
Only three subindustries, agriculture, restaurants, and food retail, show financial materiality across nine of the 10 ESRS topics. For agriculture, this reflects direct exposure to climate change, pollution, water use, biodiversity loss, and labor risks. For restaurants and food retail, similar risks are primarily transmitted through agricultural supply chain dependencies.
Figure 4. Distribution of Subindustries by Number of ESRS Topics Considered Material
Source: Morningstar Sustainalytics.
Note: Data based on the 135 subindustries in the Morningstar Sustainalytics Classification System as of January 2026.
Across all subindustries, the topics S1 Own Workforce and G1 Business Conduct are financially material in every case. E1 Climate Change is financially material for more than 81.5% of subindustries, followed closely by S4 Consumers and End Users at 80.7%. Following these topics is a mid-tier cluster that comprises E2 Pollution (45.2%), E3 Water and Marine Resources (46.7%), and E5 Circular Economy (42.2%), indicating moderate financial relevance across industries. E4 Biodiversity and Ecosystems (24.4%), S2 Workers in the Value Chain (28.1%), and S3 Affected Communities (20.0%) are financially material for a smaller share of subindustries.
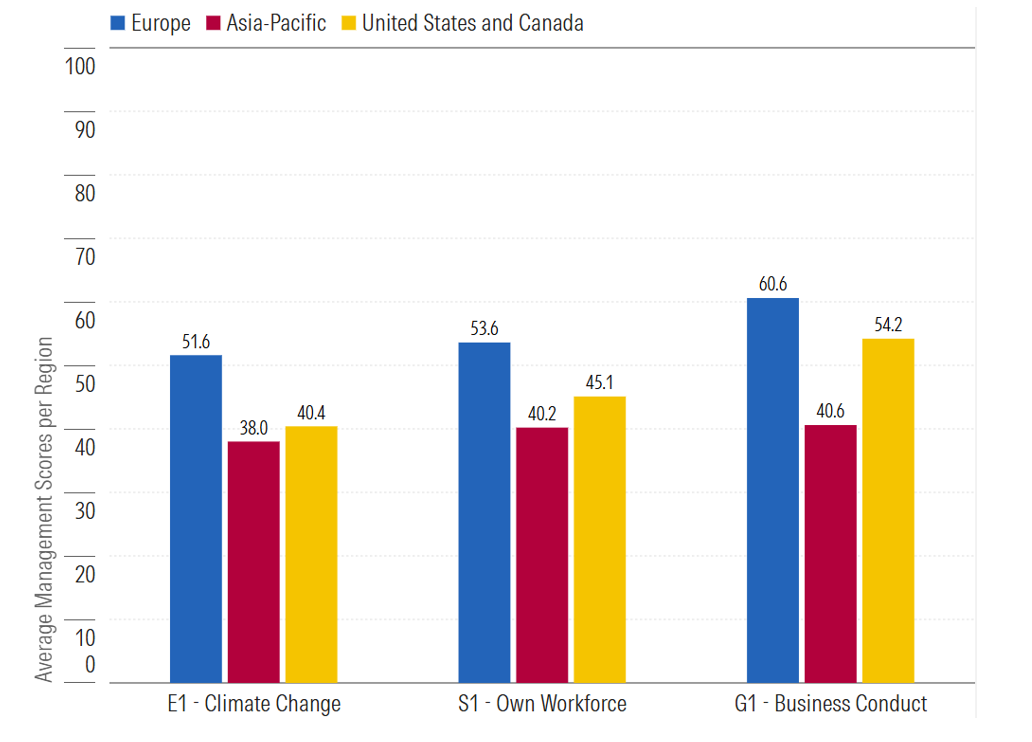
To assess preparedness for CSRD reporting, the analysis uses ESG Risk Rating Management Scores as a proxy for corporate readiness. Europe‑based companies generally score above 50, indicating more established policies, governance structures, and management systems. The materials sector stands out for consistently high scores. Regionally, Europe outperforms Asia‑Pacific by roughly 15 points and the United States and Canada by about 8.7 points, reflecting the influence of a more stringent regulatory environment.
Figure 5. Average Management Scores for Key ESRS Topics per Region
Source: ESG Risk Ratings, Morningstar Sustainalytics. Data as of January 2026.
Note: On a scale from 1 to 100.
What This Means for Investors
Despite recent efforts to simplify reporting through CSRD Omnibus I and amendments to the ESRS, double materiality remains central to the EU’s sustainability reporting framework. For investors, understanding how sustainability topics intersect with both corporate impacts and financial risks is critical to interpreting CSRD disclosures effectively.
Morningstar Sustainalytics positions the CSRD DMA tool as a resource that supports both regulatory compliance and investor decision‑making. As demand for assured and decision‑useful ESG data continues to grow, structured double materiality assessments can help investors better compare companies, sectors, and risks in a rapidly evolving reporting landscape.
References
- European Commission. 2025. Omnibus I. https://commission.europa.eu/publications/omnibus-i_en.
- United Nations. 2026. “World Enters ‘Era of Global Water Bankruptcy’: UN Scientists Formally Define New Post-Crisis Reality for Billions.” United Nations University INWEH. January 20, 2026. https://unu.edu/inweh/news/world-enters-era-of-global-water-bankruptcy.
- UNESCO World Water Assessment Programme. 2024. The United Nations World Water Development Report 2024: water for prosperity and peace. https://www.unwater.org/publications/un-world-water-development-report-2024.
- US Energy Information Administration. 2023. Food Service Buildings are Highly Energy Intensive. August 28, 2023. https://www.eia.gov/todayinenergy/detail.php?id=60241.
.tmb-thumbnl_rc.png?Culture=en&sfvrsn=a680a273_1 "2026_SUS_Blog_Exploration_V5_SIP_Resource_Center_Sans_Type (1)")