
Key Insights:
|
|
|
|
The role of the financial sector in supporting the global transition to a low-carbon economy has been the subject of much debate. A growing body of academic research and practitioner evidence challenges the assumption that investor portfolio-level net zero alignment can deliver real-world decarbonization outcomes. A report from the Columbia Center on Sustainable Investing argues that investors primarily operate through capital allocation and risk management, and that the transmission from portfolio decisions to emissions reductions is indirect, partial, and often too weak to drive meaningful changes in the real economy.1
This tension is playing out among institutional investors globally. The People's Partnership (which has more than GBP 40 billion, or USD 54 billion, in assets under management) has replaced its top-down, 1.5 C-aligned portfolio constraint with a bottom-up, evidence-based, case-by-case approach, placing greater weight on stewardship and policy engagement. This approach cautions against blunt exclusion or divestment strategies that may simply reallocate ownership without affecting underlying emissions.2 Ontario Teachers' Pension Plan (OTPP) has recalibrated in a similar direction. While retaining its 2050 net zero ambition, OTPP retired its interim portfolio emissions-intensity target in favor of a CAD 70 billion (USD 50 billion) climate transition-aligned private-markets investment target, arguing that emissions intensity is useful for comparing companies but insufficient for measuring real-world transition progress.3 CPP Investments has gone further, dropping its net-zero-by-2050 commitment altogether, on the grounds that "forcing alignment with rigid milestones could lead to investment decisions that are misaligned with our investment strategy."4
Other asset owners are moving in the opposite direction. Ilmarinen, Finland's largest earnings-related pension provider, has just committed to setting near-term science-based targets with the Science Based Targets initiative (SBTi),5 and New York City's pension systems have tightened, rather than loosened, net zero enforcement expectations on their asset managers.6 Which direction an asset owner takes appears to depend less on ideology and more on the specific problem they are trying to solve with their climate strategy.
It is against this backdrop that we have conducted a comparison of the two frameworks most immediately relevant to financial institutions seeking to develop a credible net zero strategy: the Institutional Investors Group on Climate Change’s (IIGCC) Net Zero Investment Framework 2.0 (NZIF 2.0) and the Science Based Targets initiative’s (SBTi) Financial Institutions Net-Zero Standard V1.0 (the FINZ Standard). In doing so, we focus specifically on their application to a global public equity portfolio, to ensure comparability and to reflect a core building block of most institutional investment strategies.
Our findings indicate that the two frameworks serve different purposes and are best understood as complementary rather than competing. Before choosing to apply one or both, investors should evaluate their specific use case and the problem they are trying to solve. FINZ may be better suited to investors seeking a rigorous, externally validated top-down target. It provides accountability but limited flexibility. NZIF 2.0, by contrast, is better suited to bottom-up or active portfolio decision-making such as assessing how holdings are progressing from commitment to implementation and identifying where engagement can accelerate that transition. In practice, the two could work in tandem, with FINZ setting the ambition and NZIF providing the operational framework to pursue it.
Financial Institutions’ Decarbonization Frameworks in Focus
While both frameworks are oriented toward 1.5 C alignment, they differ fundamentally in purpose, structure, and accountability regime. Those differences have material implications for how a practitioner should approach climate transition assessment and target setting.
NZIF 2.0 is a practitioner-led guide operating on an "implement or explain" basis. The framework is designed to translate net zero commitments into investment strategy and stewardship action. It emphasizes assessing asset-level alignment across a multi-criteria maturity scale covering ambition, targets, emissions performance, decarbonization plans, and capital allocation alignment. It requires portfolio decarbonization reference objectives and asset alignment targets. The portfolio decarbonization reference objective is explicitly framed as a portfolio management monitoring tool rather than a target-setting mechanism for reducing financed emissions through year-on-year reductions.
The FINZ Standard, by contrast, is an entity-level formal certification framework requiring third-party validation. It imposes mandatory near-term and long-term portfolio climate-alignment targets, prescribes a fossil fuel transition policy with phaseout timelines, and segments financial activities into a set of exposure categories ranging from A through D7 with differentiated ambition milestones in 2030, 2035, and 2040. For a comparison overview, see Table 1.
Table 1. Comparison of SBTi FINZ Standard V1.0 and IIGCC NZIF 2.0 Frameworks
| Dimension | SBTi FINZ Standard V1.0 | IIGCC NZIF 2.0 |
|---|---|---|
| Definition of Alignment | Portfolio alignment with a 1.5°C emissions pathway, based on financed emissions trajectories | Contribution to real-economy transition, incorporating portfolio positioning and investor influence |
| Primary Measurement Mechanism | Quantitative portfolio emissions metrics (absolute / intensity reductions) | Multi-dimensional:
|
| Forward-looking Element | Modeled emissions trajectories vs. pathways | Assessment of company transition credibility and future alignment |
| Definition of Impact | Implicit – assumed to arise from portfolio alignment | Explicit – achieved through multiple channels |
| Primary Impact Mechanism | Capital allocation (via cost-of-capital effects) | Combination of capital allocation, stewardship/engagement, and system-level influence |
| View of Investor Influence | Investors influence transition primarily through portfolio reallocation | Investors influence transition through engagement, capital allocation, and policy/system change |
| Strengths |
|
|
| Limitations |
|
|
In practice, an investor using both frameworks could benefit from the operational rigor of NZIF 2.0, particularly its multi-criteria engagement framework and asset-level scoring, while also gaining the external credibility and regulatory recognition that comes with an SBTi-validated commitment. However, this comes with the risk of competing logic. NZIF explicitly cautions that portfolio decarbonization metrics should not be used as direct investment decision tools, while the FINZ Standard sets mandatory coverage thresholds that can create tension with active management approaches.
Using the Morningstar Global Target Market Exposure Index, which captures the top 85% of global market cap across developed and emerging markets, along with Morningstar Sustainalytics data, enabled a worked example. This can serve as a useful stress test of both frameworks.
The index spans large-cap equities across sectors with highly heterogeneous transition readiness. It includes everything from semiconductor firms with narrow but growing scope 2 footprints to integrated oil and gas majors with structurally challenging scope 3 positions. As such, using this index for our analysis surfaces the distinct and sometimes conflicting diagnostics each framework produces for the same underlying portfolio. The analysis raises honest questions about the extent to which either framework reliably distinguishes genuine alignment progress from disclosure-driven classification.
Analysis: Comparing NZIF and FINZ
Explanation of NZIF Criteria
While NZIF 2.0 comprises six core areas that support investors in assessing their portfolios through a climate lens, this analysis concentrates on the asset-level assessment of listed equities. Under the framework, listed equity and corporate fixed income assets are assessed against six criteria, along with a distinct "achieving net zero" threshold, which together determine their classification across five alignment categories, from "not aligning” to “achieving net zero.” The assessment criteria are as follows:
Ambition | A long-term goal consistent with achieving net zero by 2050. |
Targets | Short- and medium-term science-based targets to reduce greenhouse gas (GHG) emissions. |
Emissions performance | Current absolute or emissions intensity at least equal to a relevant net zero pathway. |
Disclosure | Disclosure of operational scope 1, 2, and material scope 3 emissions. |
Decarbonization strategy | A quantified set of measures to achieve short- and medium-term science-based targets by reducing GHGs and increasing green revenues where relevant. |
Capital allocation alignment | A clear demonstration that capital expenditures are consistent with a relevant net zero pathway. |
Achieving net zero requires meeting all criteria plus having current emissions intensity at or near zero, with an investment plan expected to maintain that performance.
NZIF’s nonprescriptive design means investors must make their own judgment calls on data sources and thresholds used to evaluate their portfolios. In practice, investors typically use sources like company disclosures and reports aligned to the Taskforce for Climate-related Disclosures framework, SBTi validation, and third-party data providers.
Analysis of Morningstar Global Target Market Exposure Index Against NZIF
This analysis uses data from Sustainalytics’ Climate Transition Toolkit mapped to the NZIF framework.8 As NZIF does not prescribe which data maps to each criterion, this analysis reflects one of many possible interpretations of its guidance.
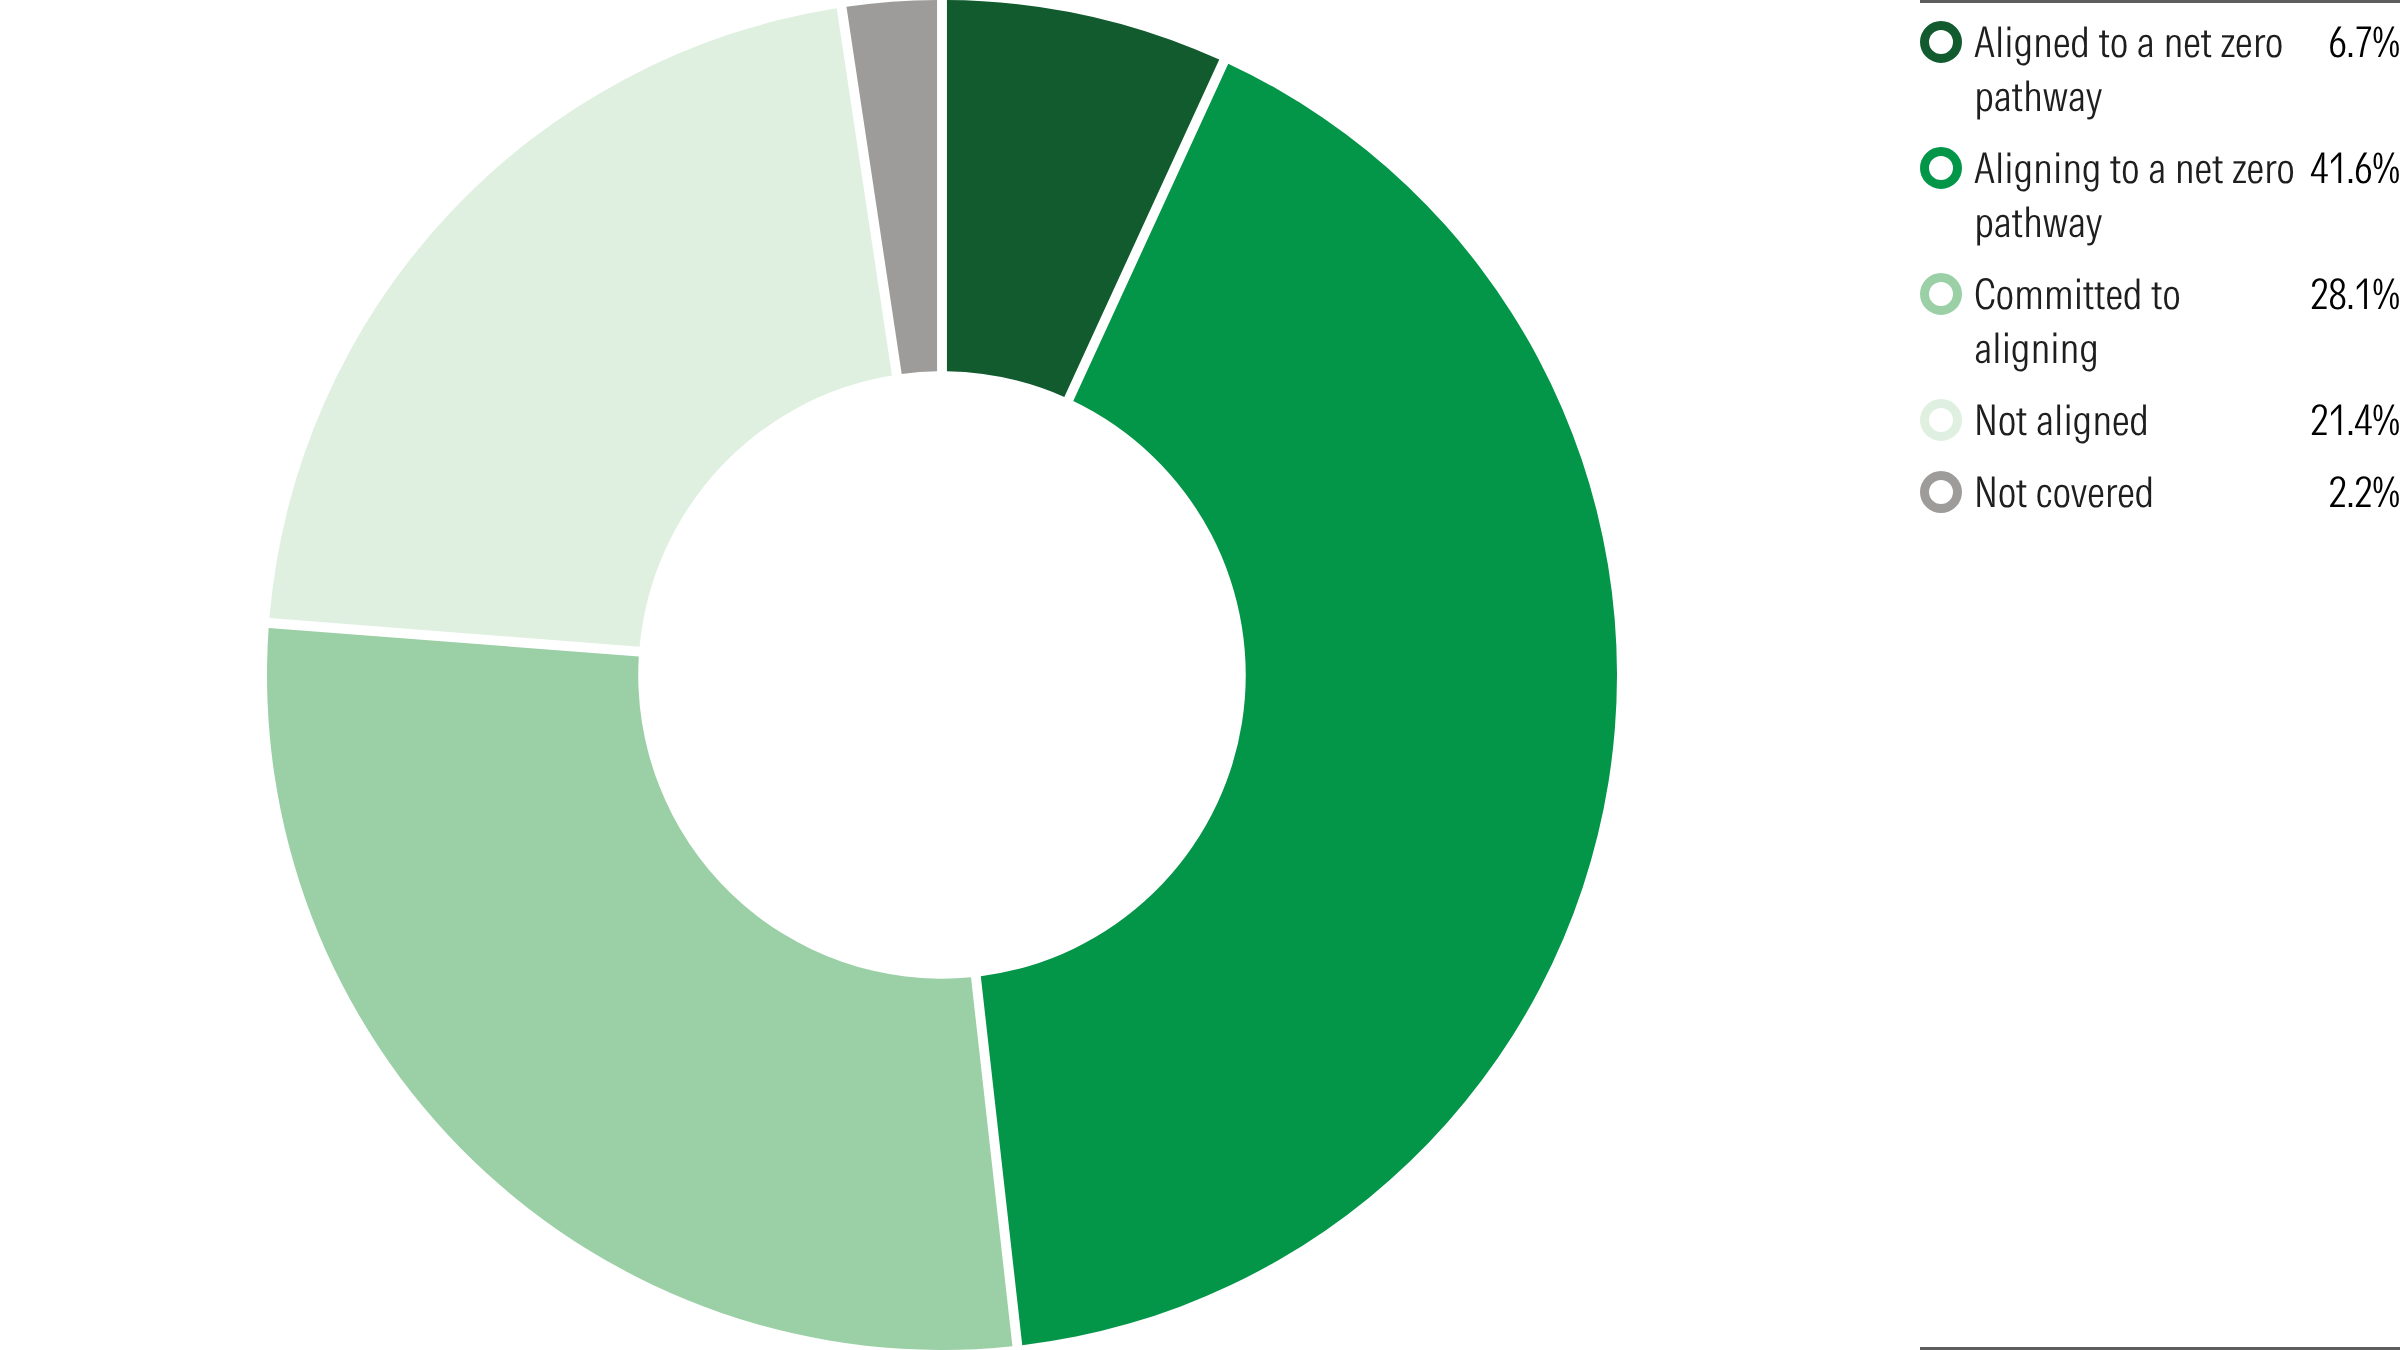
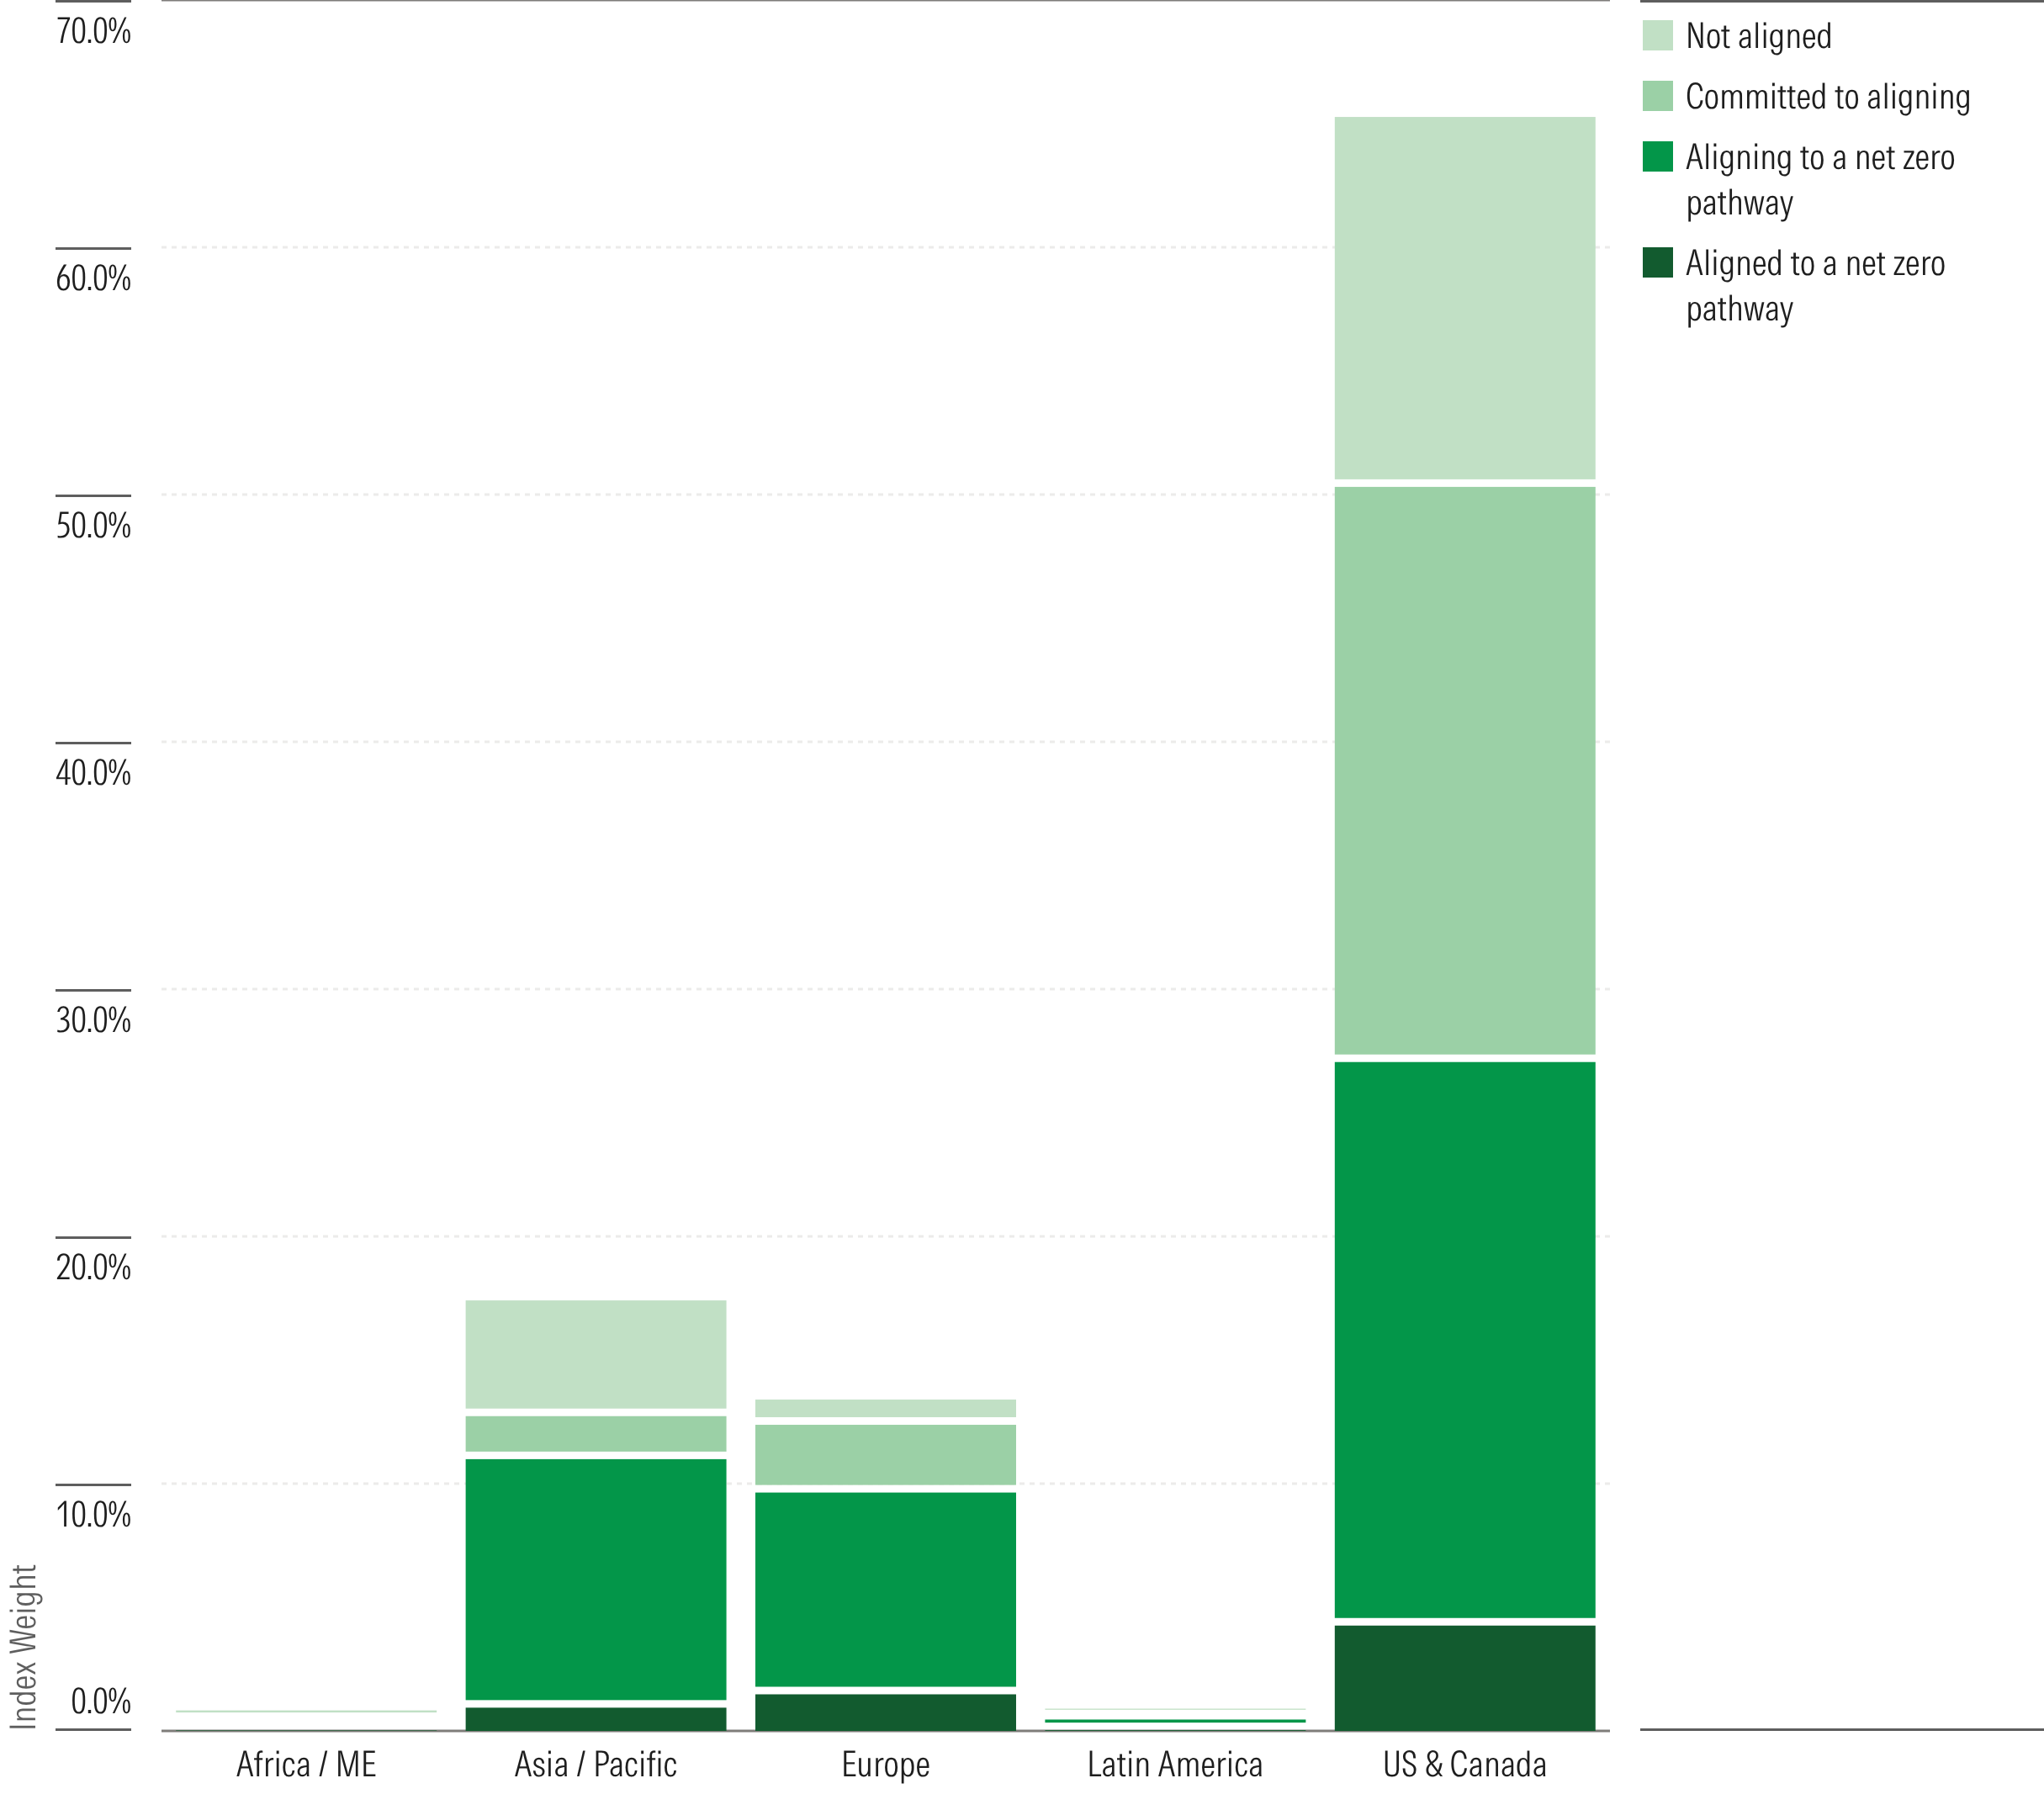
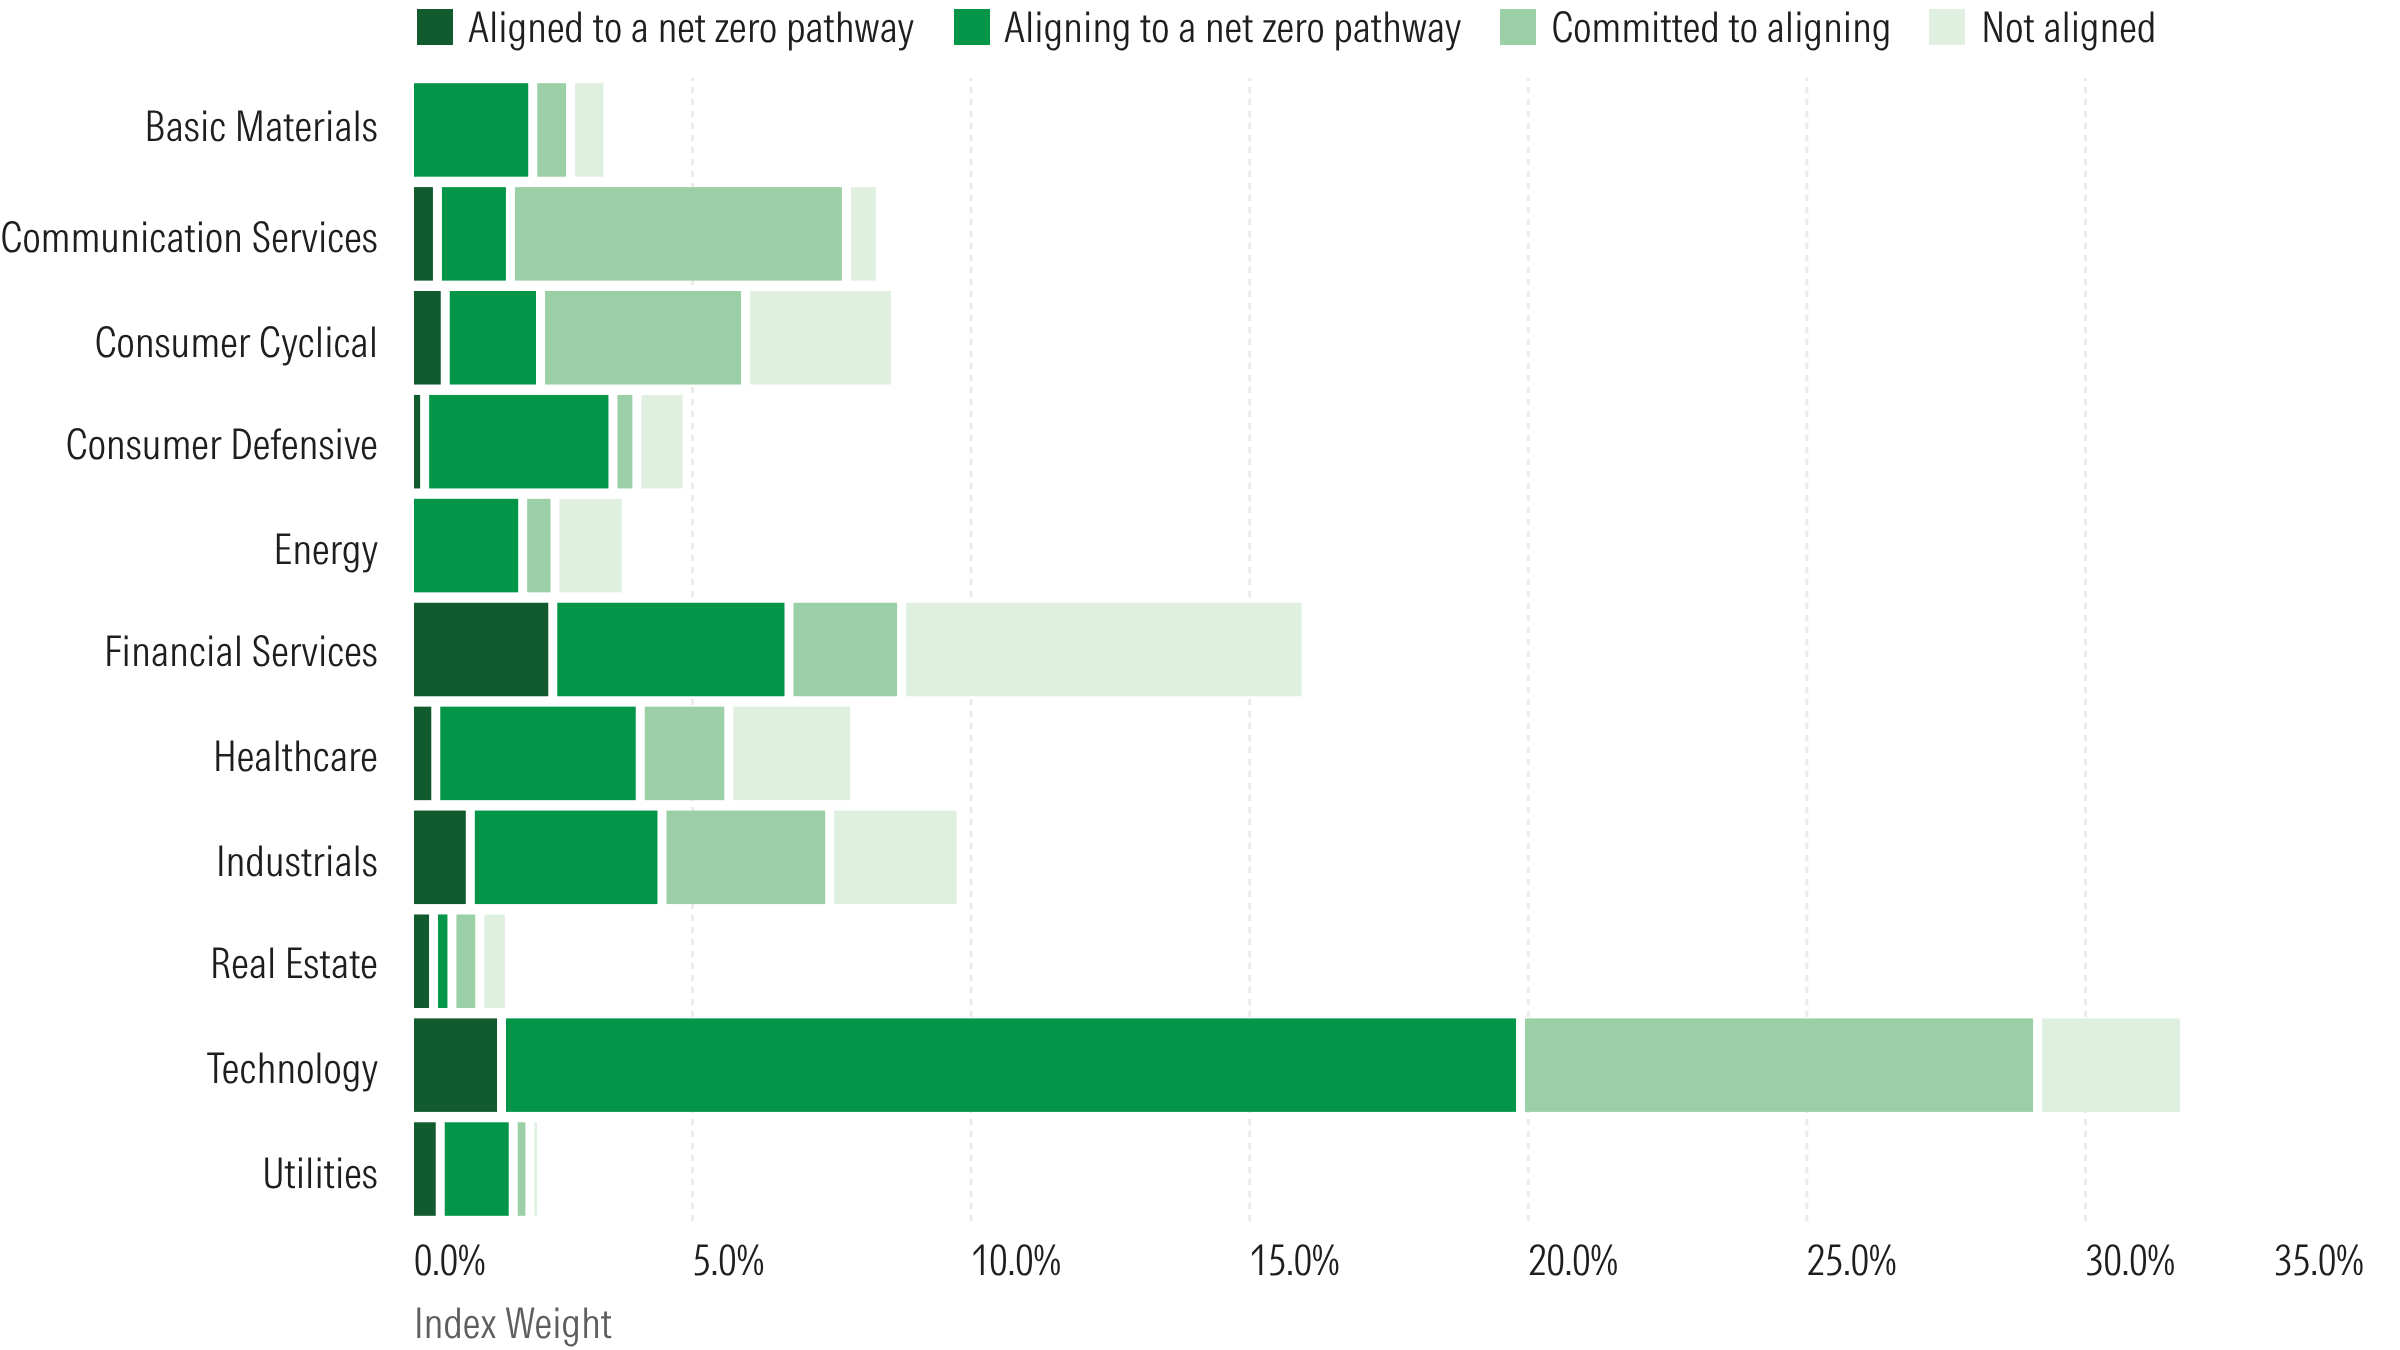
The figures show the Morningstar Global Target Market Exposure Index constituent weights broken down by NZIF alignment category overall, and how much of the portfolio is not aligned by weight (Figure 1) and the distribution of alignment categories across Morningstar regions (Figure 2) and sectors (Figure 3). These illustrate the net zero alignment of a standard market-cap-weighted global equity portfolio and areas of misalignment. Read together, the three figures show that alignment remains the exception rather than the rule.
Figure 1. Morningstar Global Total Market Exposure Index by NZIF Alignment Categories and Constituent Weight
Source: Morningstar Indexes, Morningstar Sustainalytics.
Note: Index constituents as of June 15, 2026. Sustainalytics data as of June 3, 2026.
On a constituent-weight basis, the majority of the index sits in the not aligned, committed to aligning, or aligning to net zero pathway categories, with only 6.7% of index weight reaching aligned to net zero pathway (Figure 1).
Figure 2. Morningstar Global Total Market Exposure Index by NZIF Alignment Categories, Region, and Constituent Weight
Source: Morningstar Indexes and Morningstar Sustainalytics.
Note: Index constituents as of June 15, 2026. Sustainalytics data as of June 3, 2026.
The regional breakdown (Figure 2) is uneven. US and Canada carry the highest aligned weight, however, this is largely driven by geographic weights in the index, as constituent companies in this region make up 65.3% of the index by weight.
Figure 3. Morningstar Global Total Market Exposure Index by NZIF Alignment Categories, Sector, and Constituent Weight
Source: Morningstar Indexes and Morningstar Sustainalytics.
Note: Index constituents as of June 15, 2026. Sustainalytics data as of June 3, 2026.
The sector view (Figure 3) is where the concentration of misalignment is most visible. Energy shows the weakest alignment of any sector with no constituent in the aligned category. The basic materials sector also skews heavily unaligned, whereas financial services, technology, and industrials account for most of the aligned weight. Taken together, the figures indicate that a standard market-cap-weighted global equity portfolio is structurally misaligned under NZIF, and that the misalignment is driven by identifiable sector and regional concentrations rather than being spread evenly across holdings.
SBTi FINZ Standard Data Requirements
The FINZ Standard doesn't directly evaluate portfolio companies but rather evaluates the financial institution holding the companies. For a financial institution to meet its requirements under FINZ-C6 (GHG inventory), FINZ-C7 (base-year climate-alignment assessment), and ongoing reporting under FINZ-C17 (annual progress reporting), it needs a specific set of data on each counterparty, or each entity to which an investor provides capital through equity, debt, or other financing arrangements, and whose climate performance is assessed within the framework.
To keep this analysis focused, we looked only at how companies are classified for climate alignment under the FINZ Standard. We did not assess other framework requirements, such as fossil fuel transition policies, revenue classifications, sector-specific measures, or exposure to fossil fuel and deforestation expansion. These require different data and methods from those used in the NZIF alignment assessment.
How Portfolio Alignment Is Assessed Under SBTi FINZ
The most operationally complex requirement is the counterparty-level climate-alignment assessment. Institutions must classify each entity, project, or asset in their portfolio into one of four categories: in transition, climate solution, net zero state, or not aligned (see Table 2).
Table 2. STBi FINZ Classifications
Category | Definition |
|---|---|
In transition | Applies to entities demonstrating climate transition ambition consistent with limiting warming to 1.5 C, covering scope 1, 2, and 3 emissions. For oil and gas entities, there is an additional hard condition: they must not be engaged in new fossil fuel expansion activities requiring a final investment decision after the institution's fossil fuel transition policy publication date. |
Climate solutions | Applies to entities generating at least 90% of their revenue from activities recognized as climate solutions under eligible taxonomies and where the remaining revenue comes from no fossil fuel activity. This is a deliberately high bar. |
Net zero state | Applies to entities that have already reduced emissions to near-zero across all scopes and neutralized residual emissions. This is the end-state the standard is driving toward. |
Not aligned | Applies to anything that doesn’t meet one of the three thresholds above. This is the default classification and the one financial institutions are working to reduce. |
For evaluating counterparty alignment under the FINZ Standard, SBTi's FINZ Implementation List specifies the approved third-party climate-alignment methodologies financial institutions may use, setting minimum version and score requirements across the in transition, climate solutions and net zero state classifications. Sustainalytics' Low Carbon Transition Ratings (LCTR) has been approved as an eligible methodology for the in transition category. Investors can use LCTR’s Implied Temperature Rise scores9 to assess and demonstrate the climate alignment of their portfolios as part of a FINZ-validated net zero strategy, as we have illustrated below.
Analysis of Morningstar Global Target Market Exposure Index Against SBTi FINZ Standard
Alongside the Implied Temperature Rise, we also use Ambition Temperature Alignment in this analysis, which applies the same calculation methodology but substitutes a company's stated targets for its expected or baseline emissions. This isolates the ambition embedded in a company's disclosed targets, showing what temperature outcome would result if those targets were met in full.
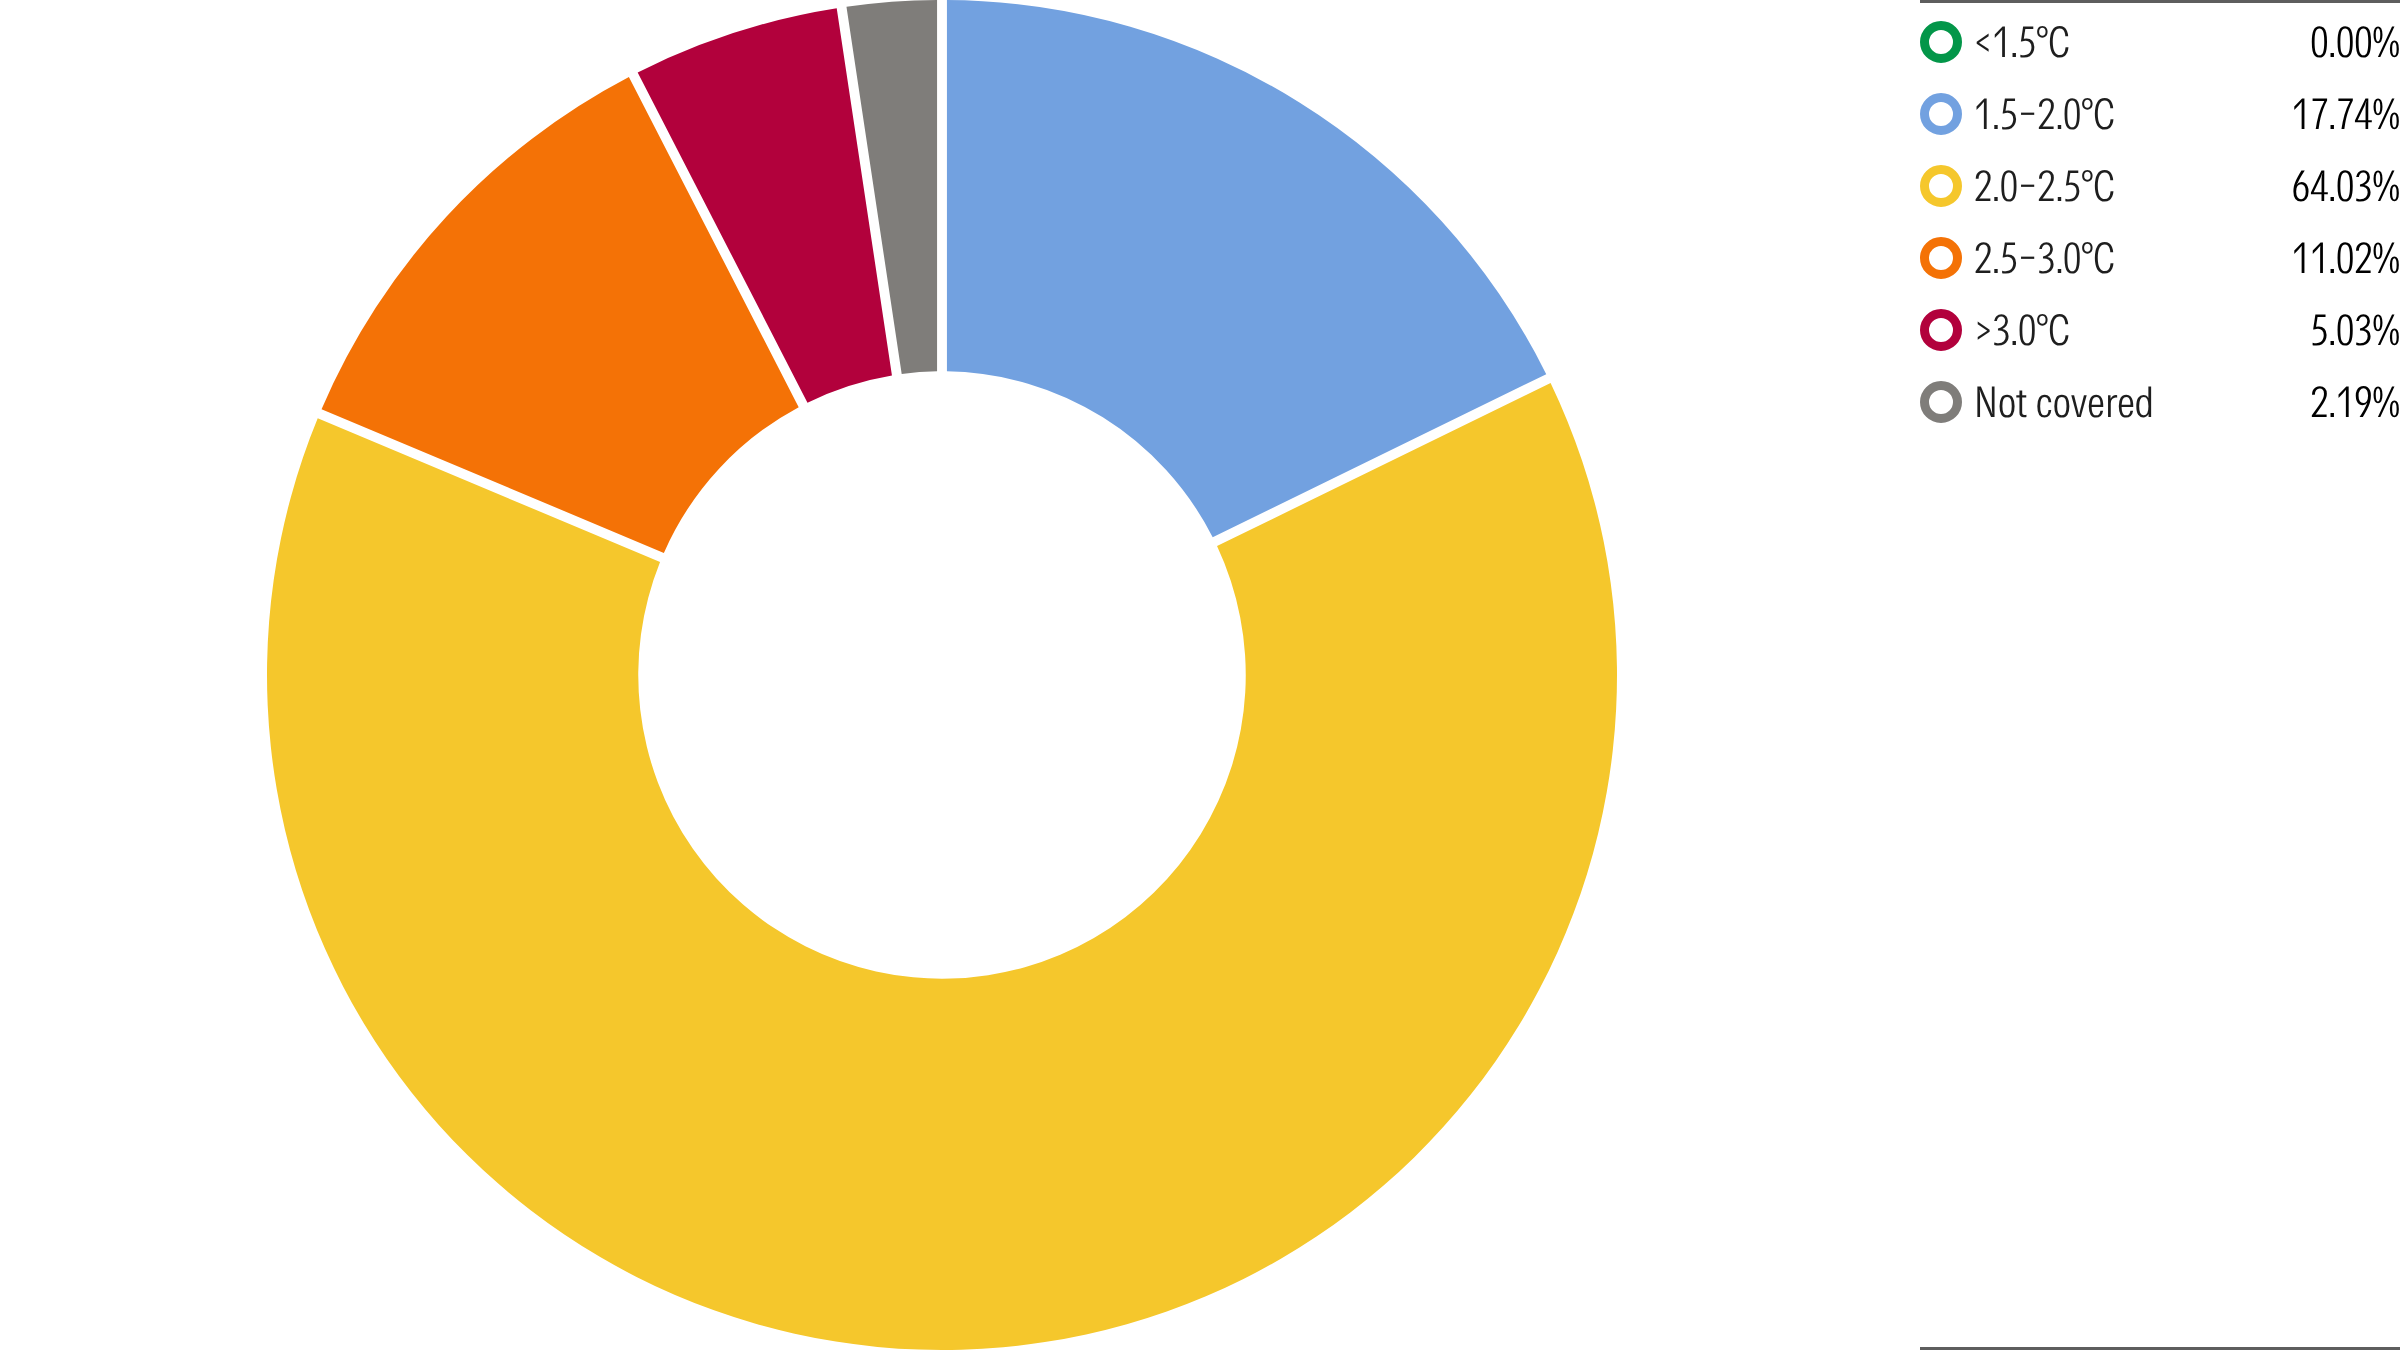
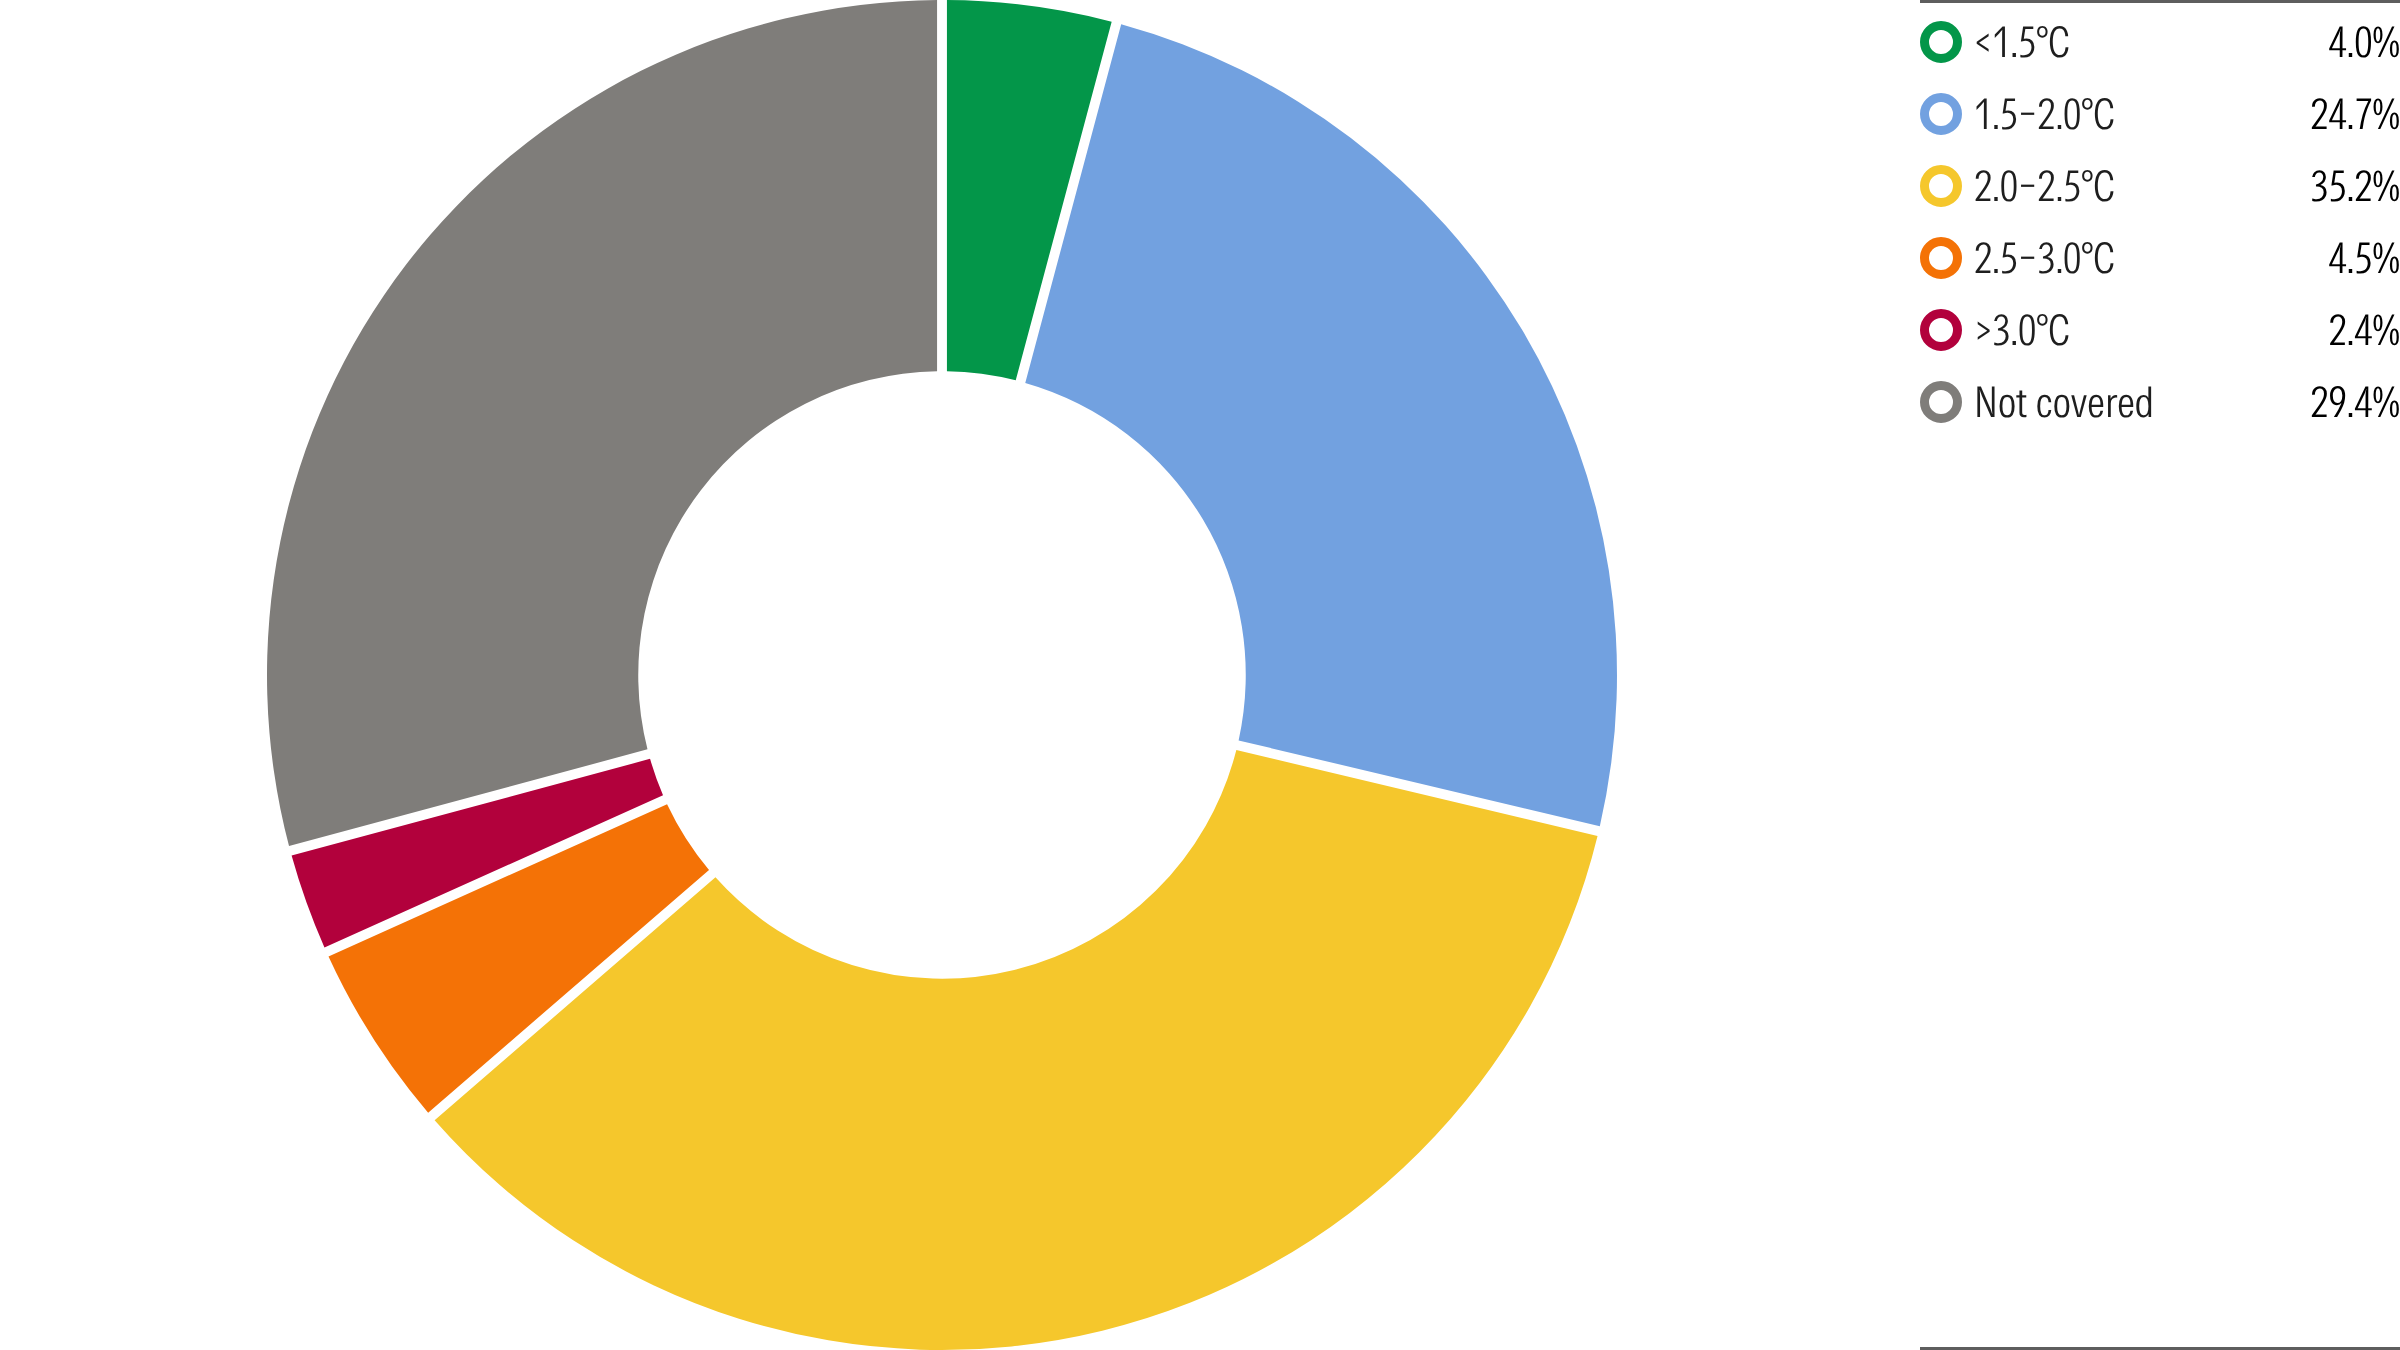
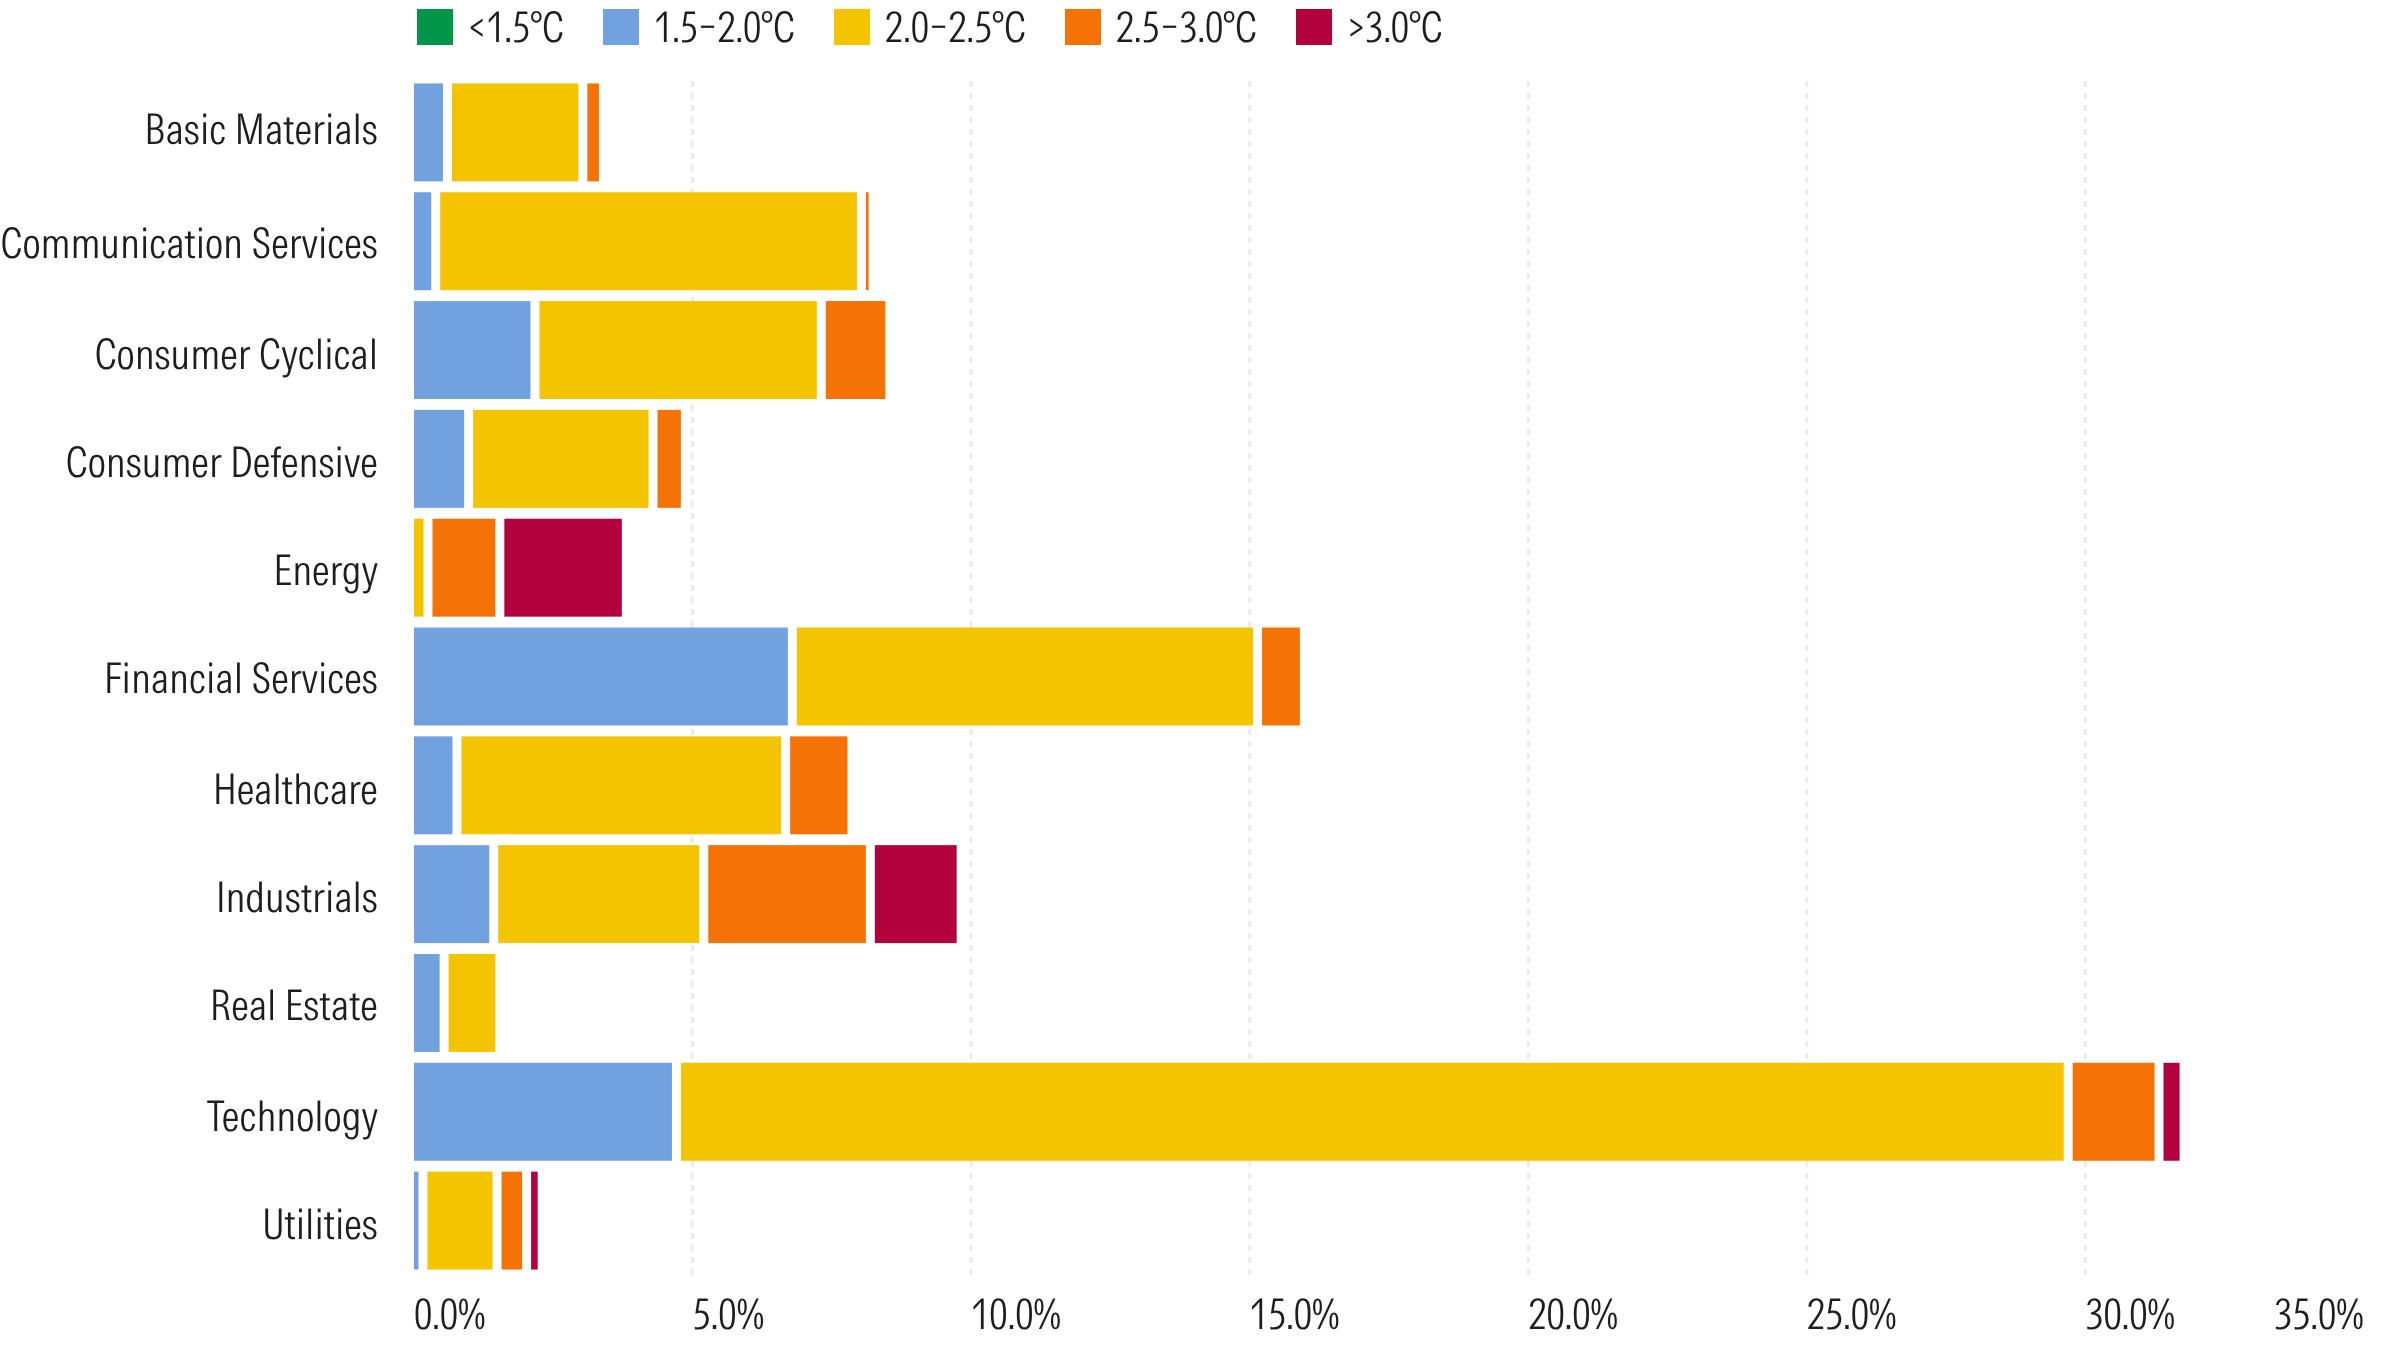
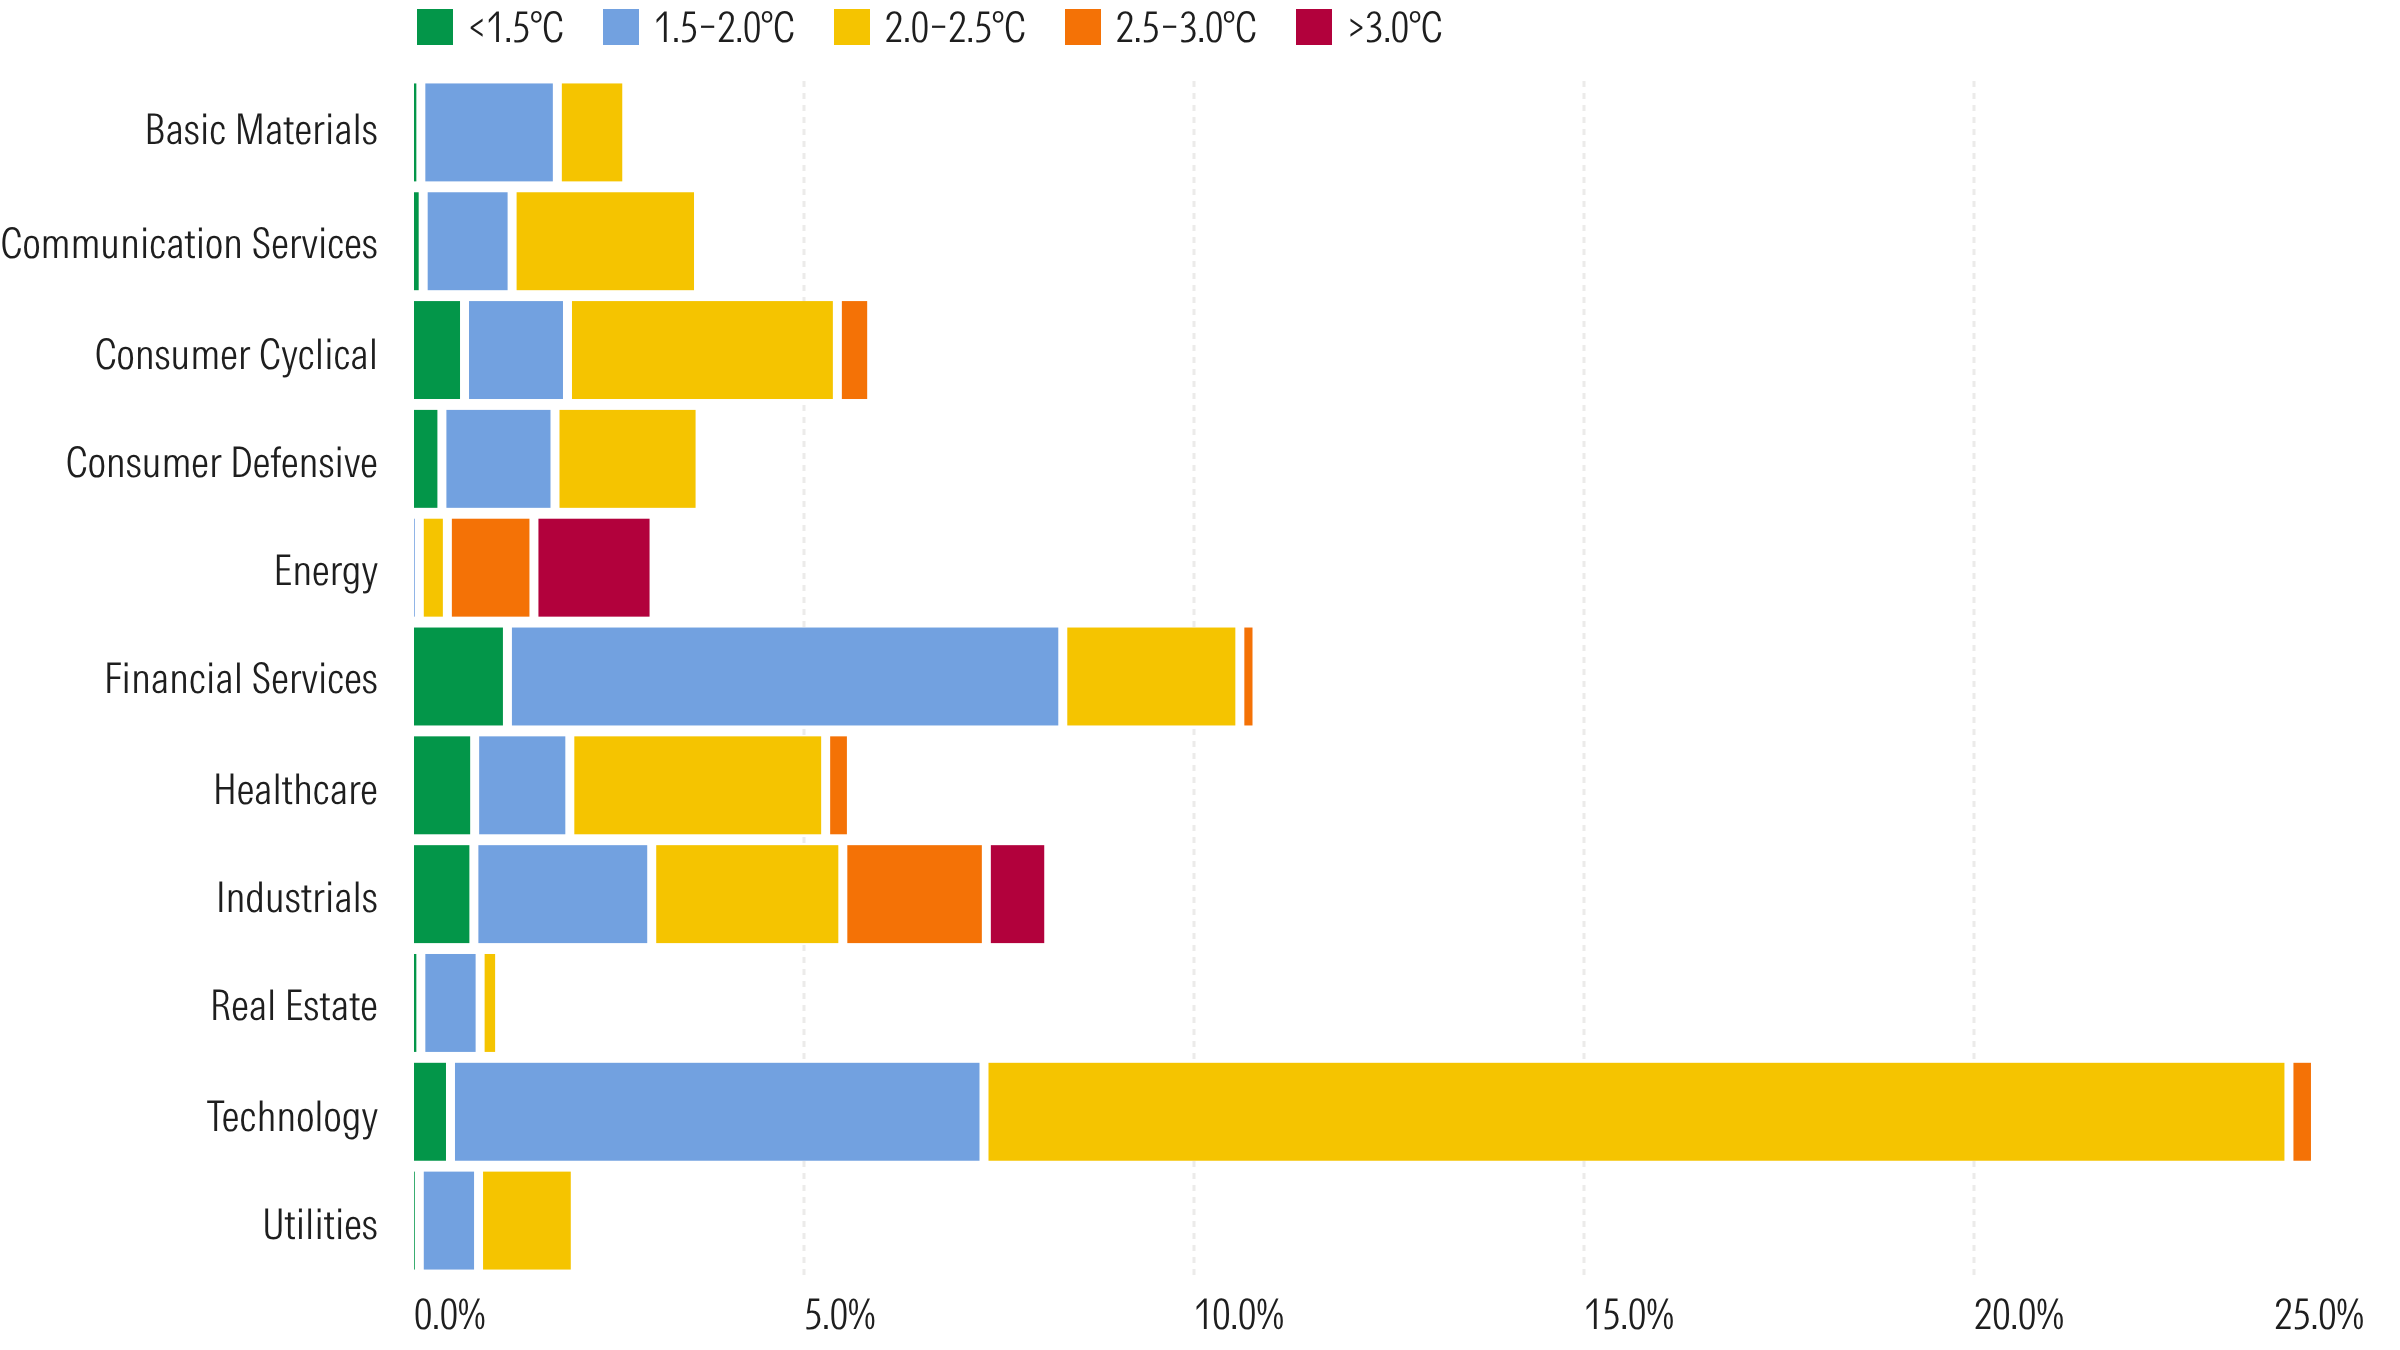
The figures show the Morningstar Global Target Market Exposure Index constituent weights broken down by Implied Temperature Rise and Ambition Temperature Alignment, showing how much of the portfolio is not aligned by weight and the distribution of alignment categories across Morningstar regions and sectors. Figure 4 and Figure 5 illustrate to what extent a standard market-cap-weighted global equity portfolio is aligned and where particular areas of misalignment concentrate.
Figure 4. Morningstar Global TME Index, Distribution of Implied Temperature Rise and Ambition Temperature Alignment, by Constituent Weight
Implied Temperature Rise | Ambition Temperature Alignment |
 |  |
Source: Morningstar Sustainalytics.
Note: Implied Temperature Rise: n = 2,459 companies. Ambition Temperature Alignment: n=1,281 companies. Index constituents as of June 15, 2026. Sustainalytics data as of June 3, 2026.
Figure 5. Morningstar Global Total Market Exposure Index, Distribution of Implied Temperature Rise and Ambition Temperature Alignment by Sector, by Constituent Weight
Implied Temperature Rise - By Sector
Ambition Temperature Alignment - By Sector
Source: Morningstar Sustainalytics.
Note: Implied Temperature Rise: n = 2,459 companies. Ambition Temperature Alignment: n=1,281 companies. Index constituents as of June 15, 2026. Sustainalytics data as of June 3, 2026.
The Climate Ambition-Performance Gap
One of the starkest findings from applying both frameworks to the Morningstar Global Target Market Exposure Index is the divergence between what companies say they intend to do and what their current emissions trajectories imply. Figure 4 shows that on stated ambition, 28.6% of the index by weight have an Ambition Temperature Alignment value below 2 C; measured on Implied Temperature Rise, that share falls to 17.7%. No constituent achieves a below-1.5 C Implied Temperature Rise, and the most Paris-aligned bucket (1.5 C to 1.75 C) represents just 1.6% of index weight. In short, disclosed targets look considerably more aligned than present-day performance.
The majority of the energy sector of the Morningstar Global Total Market Exposure Index by weight (60.88%) has an Implied Temperature Rise above 3.0 C, at least 1.5 degrees above SBTi FINZ’s threshold for being deemed in transition. In contrast, the majority of the technology sector of the index by weight (78.81%) has an Implied Temperature Rise between 2 and 2.5 C.
NZIF's outcome category distribution tells a similar story; energy has the lowest share of companies in the aligned category of any sector, at zero. Practitioners applying either framework need a clear position on how to handle energy companies, via engagement criteria, divestment thresholds, or explicit sector carve-outs, before portfolio-level alignment claims can be made with integrity.
SBTi and NZIF: Considerations for Investors
NZIF's graduated alignment categories — not aligned, committed to aligning, aligning, aligned, achieving net zero — provide a useful engagement map as they are built on a combination of issuer process and ambition indicators that can generate alignment classifications even where emissions trajectories remain elevated. FINZ's temperature-based signals cut through this as a company can satisfy multiple NZIF criteria and still carry an Implied Temperature Rise above 2.5 C. NZIF asks: Is this company engaging with transition in a structured way? FINZ asks: Will this company's trajectory land in a world that meets the Paris Agreement?
The challenge of applying the FINZ standard to a portfolio of companies that is misaligned is that the resulting classification information is difficult for investors to apply in decision-making. If a company is not “in transition,” there is limited insight. Ultimately, the analytical limitations of the climate-alignment classification (FINZ-C7) on its own matters because classification is only useful if it informs decisions. Sorting counterparties into buckets — in transition, climate solution, net zero state, not aligned, or not assessed — tells an investor where things stand today, but offers little to work with in terms of trajectory, urgency, or engagement priority. NZIF's five-category alignment spectrum, on the other hand, captures where companies are headed, distinguishing between those merely committed to aligning and those actively aligning to a net-zero pathway. That forward-looking granularity is what makes the difference between a compliance exercise and a tool that actually shapes portfolio strategy.
References
- Sachs, L., Fujimoto, D., and Harel, Q. 2026. From Planetary Hazard to Financial Stability: Disentangling climate risk and institutional responsibility. https://ccsi.columbia.edu/wp-content/uploads/2026/06/From-Planetary-Hazard-to-Financial-Stability.pdf.
- People’s Partnership. 2026. “People's Pension Updates Climate Approach." Press release. March 2026. https://peoplespartnership.co.uk/media-centre/press-releases/peoples-pension-updates-climate-approach.
- Ontario Teachers' Pension Plan Board. 2026. “Ontario Teachers' announces 2026-2030 climate strategy." Press release. February 19, 2026. https://www.otpp.com/en-ca/about-us/news-and-insights/2026/2026-2030-climate-strategy/.
- CPP Investments. “Approach to Sustainability." Nd. https://www.cppinvestments.com/the-fund/approach-sustainability/.
- Ilmarinen. 2026. “Ilmarinen commits to science-based climate targets." Press release. April 14, 2026. https://www.ilmarinen.fi/en/current-topics/news-and-articles/2026/tieteeseen-perustuvat-ilmastotavoitteet/.
- Office of the New York City Comptroller. 2025. "Comptroller Lander Recommends Pension Boards Drop BlackRock, Fidelity, and PanAgora Due to Inadequate Decarbonization Plans." Press release. November 26, 2025. https://comptroller.nyc.gov/newsroom/comptroller-lander-recommends-pension-boards-drop-blackrock-fidelity-and-panagora-due-to-inadequate-decarbonization-plans/.
- Science Based Targets initiative (SBTi). 2025. FINZ Standard in Brief (July 2025), 4, https://files.sciencebasedtargets.org/production/files/FINZ-in-brief.pdf.
- Morningstar Sustainalytics. NZIF Data Solution. Nd. https://www.sustainalytics.com/investor-solutions/climate-solutions/climate-transition-toolkit/nzif-data-solution.
- Sustainalytics’ LCTR Implied Temperature Rise scores are science-based, forward-looking scores that translate a company's projected greenhouse gas emissions into an expected global temperature outcome. To learn more visit https://www.sustainalytics.com/investor-solutions/low-carbon-transition.