Posted on April 30, 2024
 |  |
Alex Osborne-Saponja Associate Director, Methodology and Product Architecture | Jonathan Feldman Product Manager, Climate Solutions |
As part of the continued enhancements to our research and data solutions, Morningstar Sustainalytics recently introduced Low Carbon Transition Value at Risk (LCT-VaR) data as part of its Low Carbon Transition Ratings. The VaR is a financial metric that demonstrates the potential loss in value that a company may experience from a transition to a low-carbon economy and can be calculated for different decarbonization pathways. VaR is measured based on the policy costs of expected emissions and the impact of reduced market demand, where applicable. It is a cumulative value based on a discounted cash flow model for the years from now until 2050.
In this article, members of Sustainalytics climate and methodology teams provide additional context for the new data points, explaining how LCT-VaR is calculated and what it signals about company’s future risk under various climate scenarios.
Read on to learn more, visit our Climate Solutions web page, or contact a member of our sales team.
Much has been written about the need to decarbonize industries to meet the Paris Agreement’s goal of keeping global warming below pre-industrial levels, or 1.5 degrees Celsius. The pressure is dialing up on companies, particularly in high-emitting sectors, to take steps to achieve that goal. As demonstrated in a recent analysis of companies in our Low Carbon Transition Ratings universe, most companies are off the mark. So, it’s fair to ask, why are these companies falling behind? A possible answer: They have not been able to precisely quantify the risks climate change poses to the value of their businesses until recently.
The risks of a changing global climate, and the transition to a low-carbon economy to abate them, take many forms. As global sustainability reporting requirements continue to evolve beyond just reporting greenhouse gas (GHG) emissions, policy risks associated with the transition appear to be rising. According to a recent report by the European Central Bank, the transition-related costs for hard-to-abate sectors range from EUR 45 million for corporates early in their net zero journey and EUR 94 million for those that have not begun.
Thirty-seven oil and gas producers are planning to have profitable businesses by the year 2050. Shareholders, activists, and governments are asking them to decarbonize their operations. Consider the following figures:
- Total enterprise value of 37 oil and gas producers in 2023: USD 3.59 trillion1
- Total capital expenditure required by all oil and gas producers to stay ahead of the low carbon transition by 2030: USD 600 billion2
- Total value-at-risk of 37 oil and gas producers due to the low carbon transition in 2050: USD 2.87 trillion3
If each oil and gas producer invested their portion of USD 600 billion (equivalent to less than 17% of their total enterprise value in 2023) into decarbonization efforts over the next six years, they may protect their market value and gain access to a value pool of USD 650 billion to USD 1.15 trillion.4 If they continue as they have been, they may see their total enterprise value drop by almost 80%.5
Value at Risk: Quantifying Future Low Carbon Transition Risk
How can investors quantify their portfolio companies’ transition risk? It is an inherently complex process, and appropriate assessment of transition risk must go beyond greenhouse gas (GHG) emissions due to the system level changes that impact different sectors. The ability to meaningfully quantify forward-looking transition risks relating to market changes, policy costs and technological advances is increasingly important. As these risks materialize and cause market shocks, focusing solely on historical greenhouse gas emissions may lead to shortcomings in understanding the impacts of a low-carbon transition on a company.
To conduct a robust assessment of a company’s transition risk requires a more complex understanding of its governance, strategy, and present and future-looking metrics. Understanding both the short- and long-term ability of a company to manage transition risk is key to assess its potential value degradation due to the transition to a low carbon economy.
Morningstar Sustainalytics’ Low Carbon Transition Ratings methodology considers many such management factors, as well as differing time horizons to derive two primary signals quantifying transition risk: implied temperature rise (ITR) and value-at-risk. Using the Inevitable Policy Response’s Required Policy Scenario in our LCT-VaR approach, in combination with our management preparedness model, allows for an assessment of both short- and long-term risk in our LCT-VaR metrics and research, tackling both the common myopia of corporates and the long-term view of transition scenarios.
The LCT-VaR data supports voluntary and mandatory climate reporting, providing additional insights into the potential low-carbon transition risk a company may face, and complementing the ITR. Where the ITR indicates through a degree measurement a company’s overall contribution to a warming climate, the LCT-VaR shows the potential absolute loss in value a company may experience from the transition to a low-carbon economy.
Low-Carbon Transition – Value at Risk Inputs Capture Nuanced Variables in Transition Risk
Risk Models
The LCT-VaR is supported by a sophisticated dual risk model that enables the quantification of a company’s transition-related risk and is tied to its underlying expected emissions projection based on its Low Carbon Transition Rating. Our approach to valuing transition risk consists of two core components:
- A policy risk model, which is applied to all companies based on their exposure to scenario carbon pricing, and
- A market risk model which is applied to the oil and gas sector, considering market demand changes and the impact on revenue generation.
The outputs of these models are further transformed using a discounted cashflow model to give an LCT-VaR value. The LCT-VaR is provided both as an absolute currency (USD) value as well as a percent (%) value relative to a company’s enterprise value including cash (EVIC). These absolute and relative LCT-VaR values are indicative of the impact of a low carbon transition under a given scenario, on a company’s future cashflow.
Our LCT-VaR model demonstrates a robust indication of the value impacts of varying rates of decarbonization for companies across all sectors, providing metrics and research that allows for Taskforce for Climate-Related Financial Disclosure (TCFD)-aligned regulatory and voluntary reporting.
Climate Scenarios
The road to 2050 is going to be a challenging one, however there are multiple scenarios by which we may arrive there and still limit global temperature rise to less than 2 degrees Celsius. Scenarios can be classified under the disorderly, orderly, and hot house world approach to support regulatory reporting for investors. Figure 1 shows the classification of the scenarios used by Sustainalytics, based on the definitions provided by the Network of Central Banks and Supervisors for Greening the Financial System.
The Low Carbon Transition Rating provides a value for each of the following scenarios: the Inevitable Policy Response’s Required Policy Response (IPR RPS), the Inevitable Policy Response’s Forecast Policy Scenario (IPR FPS), and the International Energy Agency’s Net-Zero by 2050 (IEA NZE) scenario. The International Energy Agency’s Stated Policy Scenario (IEA STEPS) is used to model a baseline scenario.
Each of these scenarios have different assumptions about changes in policies, behaviors, and technologies, which provide useful insights for investors. For example, the IPR FPS is a high-confidence, high-probability disorderly transition scenario based on what is likely to occur. The IPR RPS indicates what must occur for an orderly net zero transition but relies on behavioral changes rather than carbon capture technology. The IEA NZE is also an orderly net zero scenario but assumes significant advances in carbon capture technology will occur.
The following analysis will focus on the results of the LCT-VaR using the IPR RPS scenario.
Figure 1. Climate Scenario Classification

Source: Morningstar Sustainalytics. For informational purposes only.
Expected Emissions Projections
The IPR RPS data used in the underlying risk models are coupled with company-specific data around operations and physical locations to influence the sector-level LCT-VaR range. For example, the high carbon price in advanced economies in combination with the company-level expected emissions projection and asset split means that companies operating in these regions will be more at risk from a higher and increasing cost of carbon. Those with low emissions, though at risk of carbon pricing, are less likely to realize costs to such high magnitudes. The approach demonstrates the financial impacts to a given sector, while still considering the heterogeneity of company-specific business practices in the context of an orderly transition to net zero.
Our proprietary policy risk model is based on the expected emissions projection of a company. This incorporates policy risk based not only on its historical emissions, but also accounts for how current stated policies, programs, and other management actions will impact GHG emissions in the future. The expected emissions projection to 2050 is then subject to the policy risk model.
Figure 2. Expected Emissions Projection Forms the Basis of Policy Risk

Source: Morningstar Sustainalytics. For informational purposes only.
Operating Region and Scenario Price
In addition to a company’s expected emissions projection, we consider the location of key operations to determine the emissions contribution in each region. We then apply the current World Bank carbon price or the scenario price for the baseline year. The source of the price is dependent on whether there is a current pricing mechanism in place; where there is, the World Bank Price is used, and where there is no current country-level price, the scenario price is utilized. For example, a company with operations in the EU will be subject to the price from the World Bank, based on the EU Emissions Trading System price, whereas U.S. operations would be covered by the scenario price, as there is currently no country-level pricing in the U.S. This approach allows us to derive a company-specific weighted carbon price. A scenario price trend is applied to replicate the price increases that a company would be exposed to under a given scenario.
Our initial data demonstrates broad ranges in relative LCT-VaR across all sectors. This is expected given the factors that drive the Total LCT-VaR output. Ranges and averages vary depending on both company-specific business models and the scenario inputs, such as location, decarbonization rate, financial health, location carbon policy price, policy price trend, and scenario demand trends. Initial observations unsurprisingly demonstrate that the oil and gas and industrials sector have the highest value-at-risk with the broadest ranges. Relative ranges are driven by EVIC, which indicate a company’s ability to absorb future costs associated with a low-carbon transition.
Transition Value at Risk is Relative: A Case Study in Oil and Gas
Under the IPR RPS scenario, fossil fuel demand must decline by 15% by 2030, and by 70% by 2040. To accommodate this increased energy efficiency, rapid deployment of low-carbon solutions is required. As a result, market risk contributes to 60% of the LCT-VaR for the oil and gas sector. The uptake of carbon pricing and a higher carbon price between now and 2030 under the IPR RPS, compounds exposure to policy risks for oil and gas companies contributing to the remainder of the LCT-VaR.
However, oil and gas companies that are demonstrating investment in low-carbon technologies,6 although still contributing significantly to warming, are comparatively reducing their LCT-VaR. For companies to continue to reduce value-at-risk in the longer term, increased investments in low-carbon solutions into the 2030s and 2040s would be required, along with a reduction in oil and gas output, reducing both policy and market risks posed under a 1.5-degree scenario.
Within the oil and gas sector, we see varying results. Company A demonstrates a reduction in emissions of 27% between now and 2030 based on its investments. As a result, while Company A has an LCT-VaR of 30% (see Figure 3), this is much lower than the industry average and lower than its competitors. Company B demonstrates an 18% increase in emissions between now and 2030, resulting in compounded market and policy risks with an overall LCT-VaR of 98%. This means that Company B is not prepared for the low-carbon transition and would find it difficult to generate returns as company value is degraded in the short and long term under the IPR PRS scenario.
Figure 3. Oil and Gas Sector LCTR-VaR Range

Source: Morningstar Sustainalytics. For informational purposes only.
However, other fossil fuel-exposed sectors demonstrate much different results. The utilities sector has a very broad LCT-VaR range, with a low average. This is largely due to the investments in renewable energy made by many utilities companies. Our research demonstrates that Company X has the highest LCT-VaR within the utilities sector (74%) (see Figure 4). Despite this, Company X, a multi-utility, has investments in renewable energy that are expected to reduce its emissions by 20% by 2040. The high LCT-VaR is a result of the company’s emissions reductions being at a much lower rate than required under the IPR RPS, increasing policy exposure, and the potential to pass through costs compared with other utilities companies. Company Y already has a high investment in renewable energy, and while the future investment indicates an increase in renewables that will reduce its emissions by 30%, this is enough to reduce the relative LCT-VaR to 3% between now and 2050.
Figure 4. Utilities Sector LCT-VaR Range

Source: Morningstar Sustainalytics. For informational purposes only.
Both Company X and Company Y are reducing their investments in fossil fuel-generated electricity, however, these reductions are not in line with the IPR RPS electricity generation expectations (see Figure 5). This therefore increases the potential for policy-related risks for both companies. However, Company Y far exceeds the rate of change in renewable energy investments against the IPR RPS rate, whereas Company X’s rate of change is lower than Company Y and much lower than the IPR RPS rate (see Figure 5). And so, we see the reasons for the difference in the LCT-VaR between the two companies. Although Company Y has investments in fossil fuel generation, these are decreasing. Meanwhile, the rate of increase in renewables is double what’s required under the scenario, mitigating the future risks of continued fossil fuel investment.
Figure 5. Comparison of Electricity Generation Investment Against 1.5 Degree Scenario

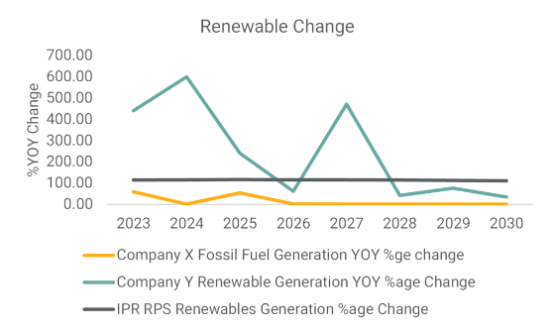
Source: Morningstar Sustainalytics, IPR RPS. For informational purposes only.
Prolonged investment in renewable energy will only continue to reduce LCT-VaR for Company Y. In fact, Company Y has reduced both the short- and long-term risks associated with an orderly low-carbon transition. On the other hand, Company X would need to both aggressively divest from fossil fuel generation and invest much more heavily in renewables to reduce the LCT-VaR faced under an orderly transition such as the IPR RPS and mitigate both long-term and short-term risks. Companies like A and Y seem poised to take advantage of that USD 650 billion to USD 1.15 trillion value pool, while Companies B and X may find themselves treading water.
Conclusion
LCT-VaR delivers a metric that allows investors to quantify the impacts of the low-carbon transition on a company’s future value.
Companies that demonstrate strong management of emissions across all scopes, while aligning to a lower carbon business model, are not always reducing the financial risks of transitioning to a lower carbon economy. Financial health is also important in determining the final LCT-VaR of a company. Our research demonstrates that a higher management score under the LCTR framework is indicative of longer-term management practices. Those companies that demonstrate strong management preparedness through investment in low-carbon solutions have lower LCT-VaR, although going forward we anticipate that other financial metrics will be needed to better determine the impact of long-termism on the ability to afford the costs of transition.
Uncertainty in future transition policies, and a volatility in both carbon and fossil fuel prices, will only compound the risk under all scenarios. However, companies reducing emissions aligned to long-term business models will reduce transition-related risk compared with those with short-termism in their sights.
What’s Next?
As we progress towards a low carbon economy, risk channels like litigation and reputational risk are likely to become more material for companies and investors. How would you prioritize these risks? Complete this short survey and tell us what you think. Your responses will inform our product innovation agenda.
References
- Morningstar.
- CDP. 2023. “Research reveals no oil and gas companies have plans in place to phase out fossil fuels.” June 29, 2023. CDP Press Release. https://www.cdp.net/en/articles/media/research-reveals-no-oil-and-gas-companies-have-plans-in-place-to-phase-out-fossil-fuels.
- Morningstar Sustainalytics’ Low Carbon Transition Ratings
- Birshan, M., Helmcke, S., Kane, S., Moore, A., and Naucler, T. 2022. “Playing offence to create value in the net-zero transition.” April 13, 2022. McKinsey Sustainability. https://www.mckinsey.com/capabilities/sustainability/our-insights/playing-offense-to-create-value-in-the-net-zero-transition.
- Ibid. CDP, 2023.
- Company investment in low-carbon technologies is assessed and modelled under Sustainalytics’ Investment Alignment indicator as part of the LCTR’s expected emissions projection. For details, please see the Low Carbon Transition Ratings methodology.
Why Sustainalytics?
A Single Market Standard
Consistent approach to ESG assessments across the investment spectrum.
Award-Winning Research and Data
Firm recognized as Best ESG Research and Data Provider by Environmental Finance and Investment Week.
End-to-End ESG Solutions
ESG products and services that serve the entire investment value chain.
30 Years of ESG Expertise
800+ ESG research analysts across our global offices.


